What is NAV Per Share?
NAV Per Share (NAVPS) represents the total value of a mutual fund, ETF, or REIT, expressed on a per-share basis.
How to Calculate NAV Per Share?
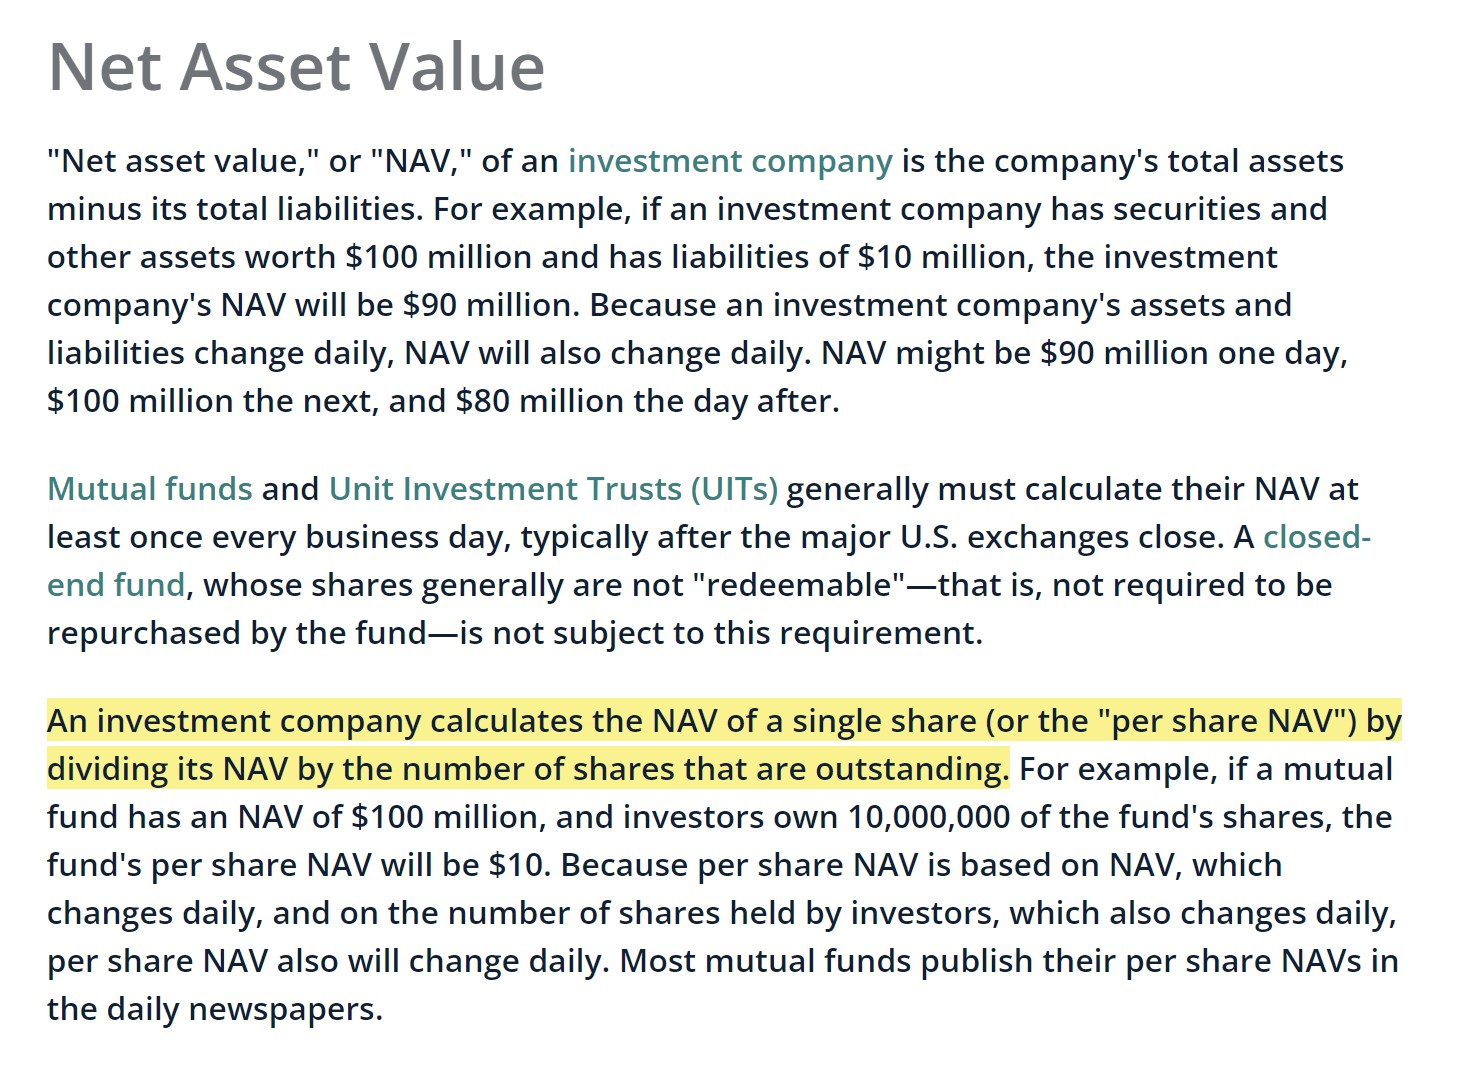
In the context of mutual funds, the net asset value (NAV) is the current market value of the fund’s portfolio and others assets, net of any liabilities.
In short, the net asset value (NAV) is the difference between the value of a fund’s assets and liabilities.
From there, the NAV per share (NAVPS) can be determined by dividing the net asset value of a fund by the total number of shares (or units) outstanding.
For the investment community, such as investors in mutual funds, the NAV per share is a method to monitor the performance of a given fund.
Because of the regulations and oversight by the SEC, mutual funds must provide full transparency with regard to performance and publicly disclose the current value of their portfolio to investors every trading date.
NAV Per Share Definition (Source: SEC Glossary)
NAV Per Share Formula (NAVPS)
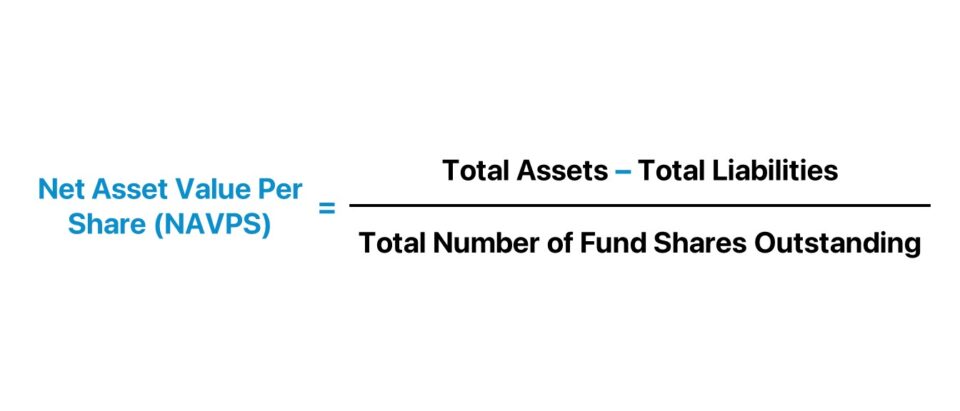
The formula to calculate the NAV per share (NAVPS) of a fund starts by subtracting total liabilities from total assets to determine the net asset value (NAV), which is then divided by the total fund shares outstanding.
The “Total Assets – Total Liabilities” component represents the mutual fund’s net asset value (NAV).
Given the net asset value (NAV) of the fund, the next step is to divide by the total number of shares outstanding to convert the NAV into a metric expressed on a per-share basis.
The Wharton Online & Wall Street Prep Applied Value Investing Certificate Program
Learn how institutional investors identify high-potential undervalued stocks. Enrollment is open for the upcoming cohort.
Enroll TodayNAV Per Share Calculator
We’ll now move on to a modeling exercise, which you can access by filling out the form below.
Mutual Fund NAV Per Share Calculation Example
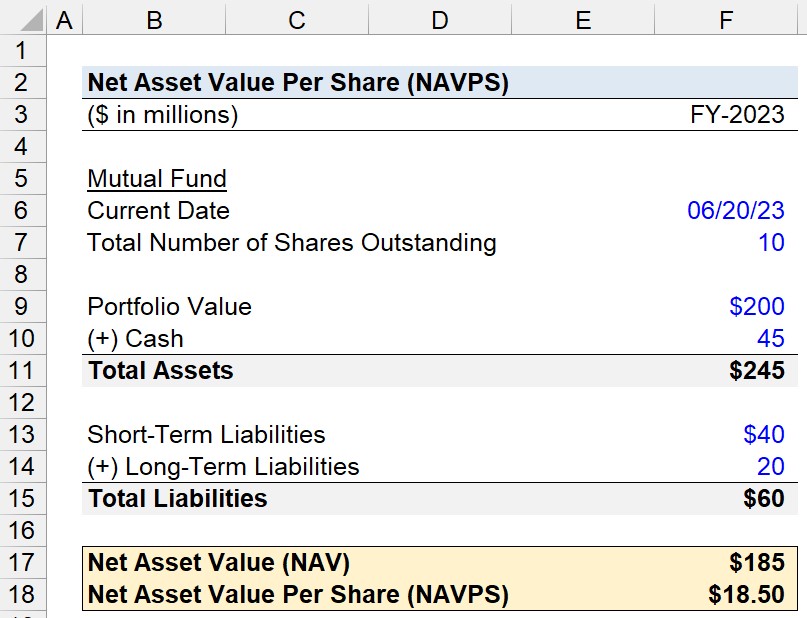
Suppose you’re tasked with calculating the net asset value per share (NAVPS) of a mutual fund as of its latest closing date (06/20/23).
On the latest reporting date of the mutual fund, the fund’s portfolio has a market value of $200 million, with $45 million in cash on the assets side.
- Portfolio Value = $200 million
- Cash = $45 million
- Total Assets = $200 million + 45 million = $245 million
On the liabilities side, the mutual fund has $40 million and $20 million in short-term and long-term liabilities, respectively.
- Short-Term Liabilities = $40 million
- Long-Term Liabilities = $20 million
- Total Liabilities = $40 million + $20 million = $60 million
Thus, the mutual fund’s balance sheet carrying values have a total assets balance of $245 million, while its total liabilities are $60 million.
By subtracting the mutual fund’s total liabilities from its total assets, the fund’s net asset value (NAV) amounts to $185 million.
- Net Asset Value (NAV) = $245 million – $60 million = $185 million
Our final assumption is the total number of shares outstanding (i.e. units) of the mutual fund, which we’ll assume to be 10 million.
- Total Number of Shares Outstanding = 10 million
Upon dividing the net asset value (NAV) of the mutual fund by the total number of shares outstanding, we arrive at a NAV per share (NAVPS) of $18.50.
- NAV Per Share = $185 million ÷ 10 million = $18.50