- What is Economic Vacancy?
- How to Calculate Economic Vacancy
- Economic Vacancy Formula
- Economic Vacancy vs. Physical Vacancy: What is the Difference?
- Economic Vacancy Calculator
- 1. Commercial Real Estate Property Building Assumptions
- 2. Gross Potential Rent Calculation Example (GPR)
- 3. Total Lost Income Calculation (Vacancy and Concessions)
- 4. Economic Vacancy Calculation Example
What is Economic Vacancy?
Economic Vacancy is the difference between the gross potential rent (GPR) of a property and the actual rental income it generates, expressed as a percentage.
How to Calculate Economic Vacancy
The economic vacancy describes the state in which a rental property is underutilized relative to its capacity.
In simple terms, economic vacancy is a method to measure unrealized potential rental income attributable to property (or unit) vacancies.
Economic vacancies occur from unoccupied rental units in a given property, albeit other unanticipated events can oftentimes cause the property to incur more costs, such as credit losses, i.e. issues with collecting rent payments from tenants.
- Higher Economic Vacancy Rate (%) → The greater the percentage spread between the gross potential rent (GPR) and the actual rental income, the more income the property owner missed out on.
- Lower Economic Vacancy Rate (%) → In contrast, the lower the percentage spread between the gross potential rent (GPR) versus the actual rental income, the closer the property’s income is to its maximum capacity.
The property owner technically did not directly incur a substantial monetary loss, aside from any spending related to marketing the unoccupied unit and routine maintenance fees (e.g. cleaning).
Instead, the more pressing matter is the foregone rental income the property could have generated if that unit were not vacant. As such, the property was not able to reach its full earnings potential, since the rental units were left unoccupied.
The step-by-step process to calculate the economic vacancy is as follows.
- Calculate Gross Potential Rent (GPR) → The gross potential rent (GPR), or potential gross income (PGI), is the total rental income that could have been generated if each rental unit were hypothetically leased with no issues related to credit losses (i.e. issues with the collection of rent).
- Estimate Actual Rental Income → Based on the most recent leasing data, determine the rental income the property is expected to earn using recent leasing data and historical precedents.
- Compute the Difference Between Gross Potential Rent (GPR) and Actual Rental Income → Subtract the gross potential rent (GPR) from the actual rental income.
- Calculate Economic Vacancy → Divide the difference computed in the prior step by gross potential rent (GPR) to arrive at the economic vacancy of the property.
- Convert into Percentage → Multiply the output in decimal notation by 100 to convert the resulting figure into percentage form.
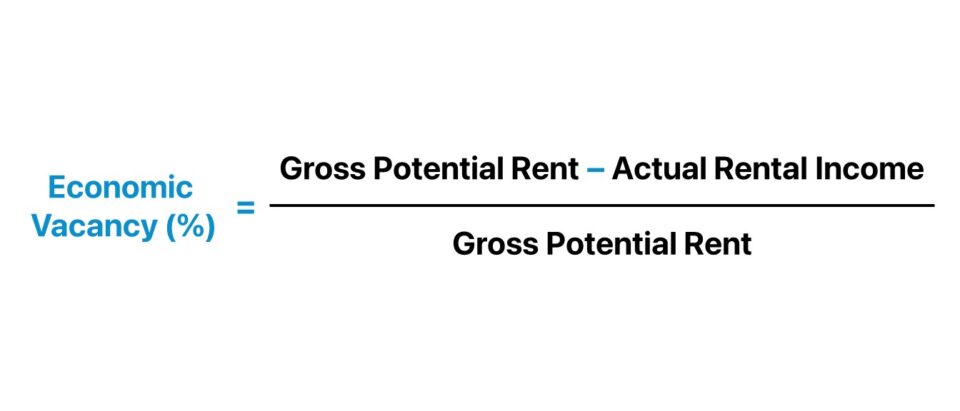
Economic Vacancy Formula
The economic vacancy formula starts by calculating the difference between the gross potential rent (GPR) and the actual rental income of a specific property, which is then divided by the gross potential rent (GPR).
Where:
- Gross Potential Rent (GPR) → The gross potential rent (GPR) is the maximum potential rental income that a rental property could generate, assuming a 100% occupancy rate (or 0% vacancy rate) and no credit losses from tenants.
- Actual Rental Income (ARI) → The actual rental income (ARI) is the rent payments the property expects to collect based on recent leasing data and existing tenants. While the actual gross income can be adjusted based on management discretion (and is thus a pro forma metric), the percentage deviation between the current occupancy rate and the projected rate should be marginal.
The Wharton Online and Wall Street Prep Real Estate Investing & Analysis Certificate Program
Level up your real estate investing career. Enrollment is open for the upcoming Wharton Certificate Program cohort.
Enroll TodayEconomic Vacancy vs. Physical Vacancy: What is the Difference?
The effective management of the vacancy rate is a critical part of the rental business model and a critical step to earning long-term, recurring income from tenants.
Therefore, property managers must constantly formulate strategies to convince new tenants to sign leasing agreements and retain existing tenants over the long term.
There are two types of vacancies in real estate that property owners and investors should pay close attention to.
| Economic Vacancy | Physical Vacancy |
|---|---|
|
|
|
|
|
|
|
|
To elaborate further on the potential causes for a low economic vacancy, the “fix” many property owners opt for is offering more concessions, reducing rent, and related tactics – which collectively contribute to a drop-off in the economic vacancy.
Economic vacancy provides more granular insights pertaining to the profitability of the rental property, while physical vacancy merely measures the percentage of unoccupied units.
Economic Vacancy Calculator
We’ll now move to a modeling exercise, which you can access by filling out the form below.
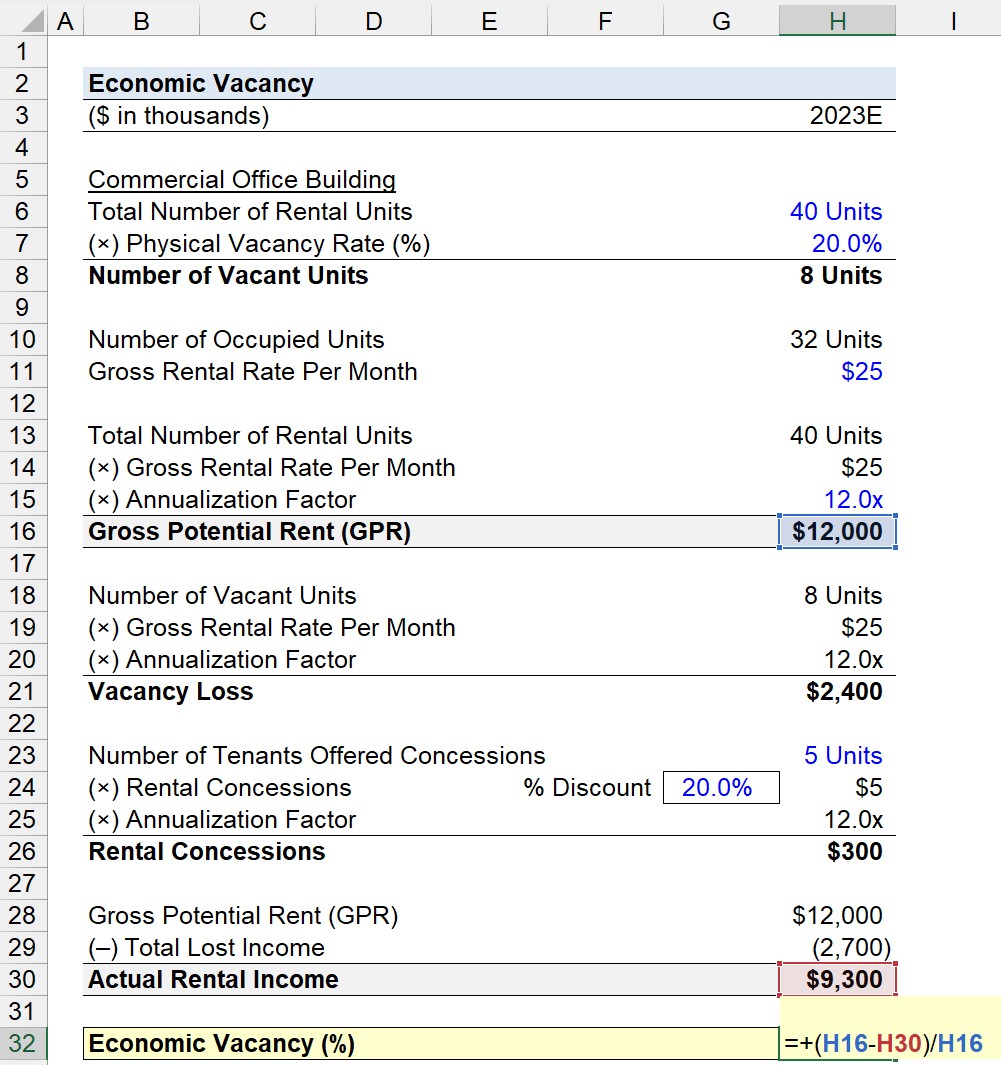
1. Commercial Real Estate Property Building Assumptions
Suppose a commercial real estate (CRE) investor is creating a near-term pro forma forecast model on a potential investment, a commercial office building located in NYC.
The commercial office building has 40 units in total, with the gross rental rate per month priced at $25k.
- Total Number of Rental Units = 40 Units
- Gross Rental Rate Per Month = $25k
Considering the price point, it is evident that most tenants are businesses that usually sign long-term lease agreements.
From there, we’ll set our assumptions regarding the physical vacancy rate at 20.0% (i.e. an 80.0% occupancy rate).
Given the physical vacancy rate of 20.0%, we can derive the number of vacant units at the commercial office building by multiplying the number of rental units by the physical vacancy rate.
- Number of Vacant Units = 40 Units × 20.0% = 8 Units
Since there are 40 units in total – of which 8 are vacant (20% vacancy rate) – the number of occupied units is 32 units.
- Number of Occupied Units = 40 Units – 8 Units = 32 Units
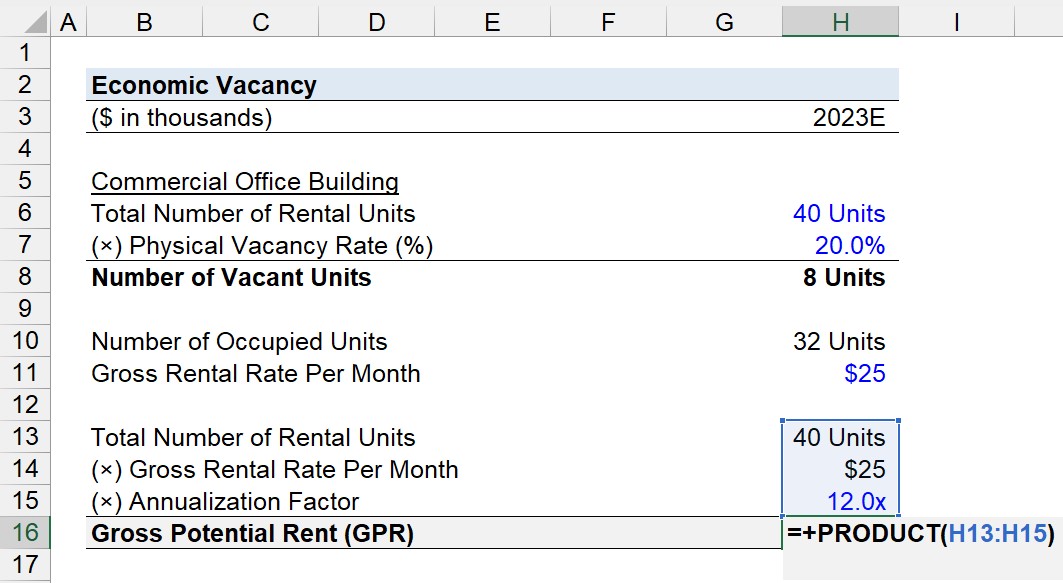
2. Gross Potential Rent Calculation Example (GPR)
In the next section, we’ll determine the gross potential rent (GPR), which should be a relatively easy process, considering the only step is to multiply the total number of rental units by the gross rental rate.
However, the gross rental rate is expressed on a monthly basis, so we must annualize the computed figure, since the economic vacancy is measured on an annual basis.
- Gross Potential Rent (GPR) = 40 Units × $25k × 12.0x = $12 million
The $12 million represents the “ceiling” of the total amount of rental income that could be obtained from the rental property.
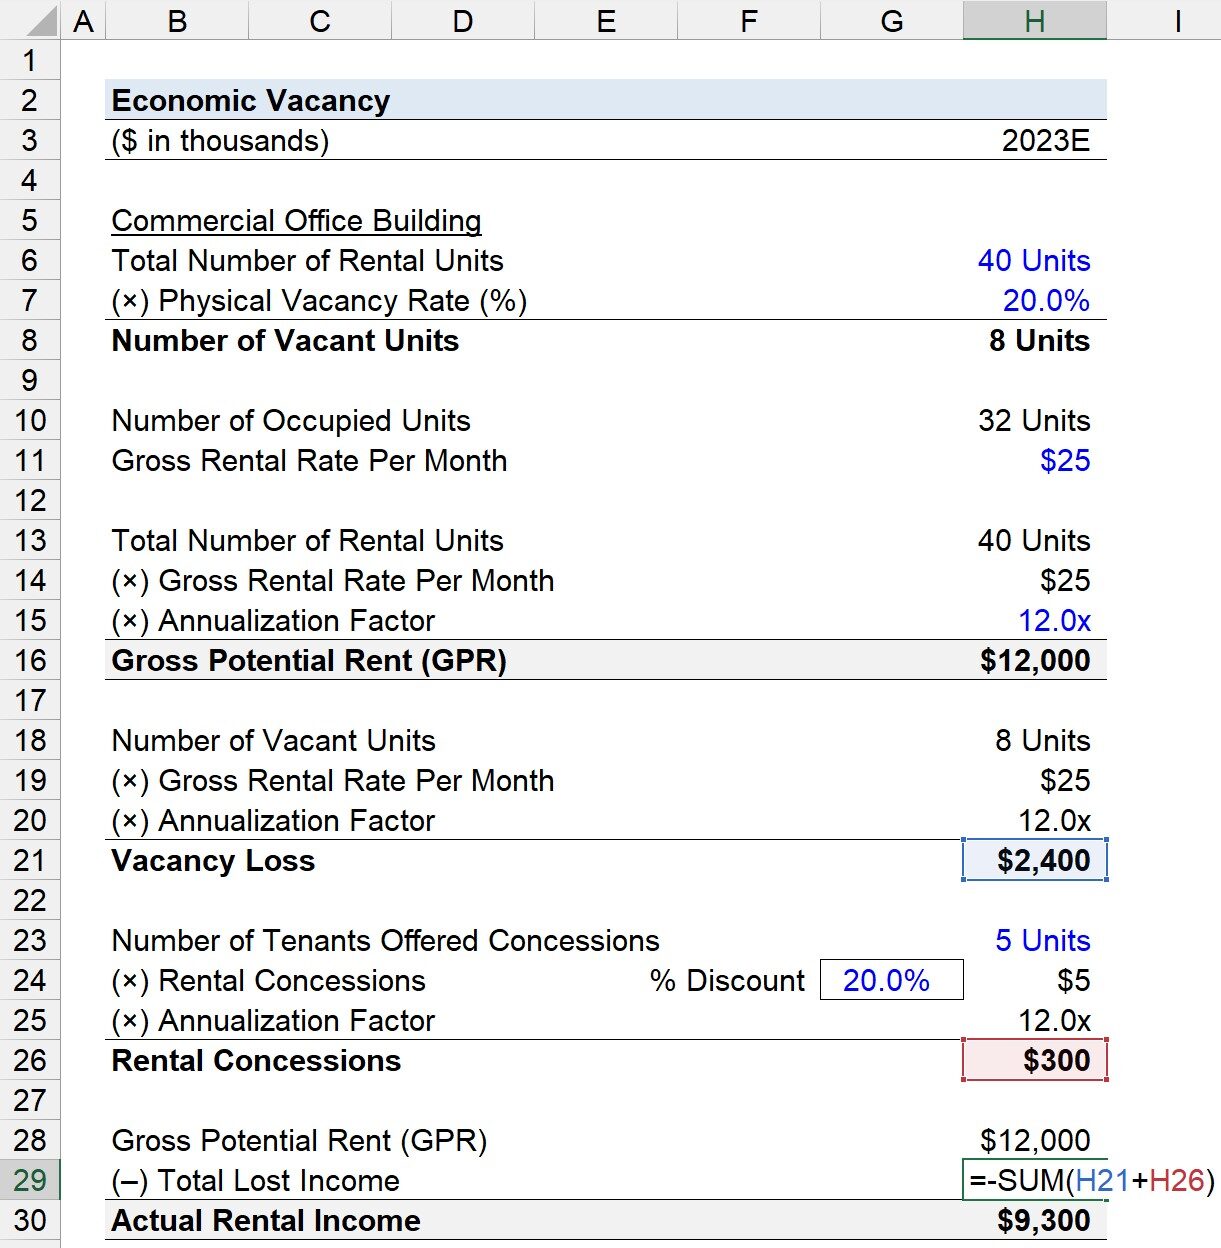
3. Total Lost Income Calculation (Vacancy and Concessions)
Since we’ve determined the commercial real estate (CRE) property’s gross potential rent (GPR), we’ll now shift to calculating the property’s total lost income.
There are two sources for the lost income component, which are: 1) the vacancy loss and 2) the rental concessions.
Calculating the vacancy loss can be performed rather quickly because the process is virtually identical to calculating the gross potential rent (GPR).
The vacancy loss is the product of the number of vacant units, the gross rental rate per month, and the annualization factor, which comes out to $2.4 million.
- Vacancy Loss = 40 Units × $25k × 12.0x = $2.4 million
On the other hand, determining the losses from the rental concessions requires some assumptions.
For the sake of simplicity, we’ll assume that 5 tenants were offered rent concessions, with the incentive being a 20.0% discount off the gross rental rate each month for the next twelve months, i.e. the trade-off in offering the monthly discount must have been worth it over the long run, because the tenants are now committing to long-term leases.
- Number of Tenants Offered Concessions = 5 Units
- % Discount = 20.0%
Therefore, the 5 tenants each save $5k per month (and $60k for the year), at the expense of the property owner.
- Monthly Discount = 20.0% × $25k = $5k
- Annual Discount = $5k × 12x = $60k
- Total Rental Concession = $60k × 5 = $300k
Similar to earlier, we’ll multiply the number of tenants offered rental concessions and the discount earned per month, and then annualize that amount, which comes out to $300k.
Upon calculating the sum of the vacancy loss and rental concessions, we can determine that the total lost income was $2.7 million in 2023.
- Total Income Lost = ($2.4 million) + ($300k) = ($2.7 million)
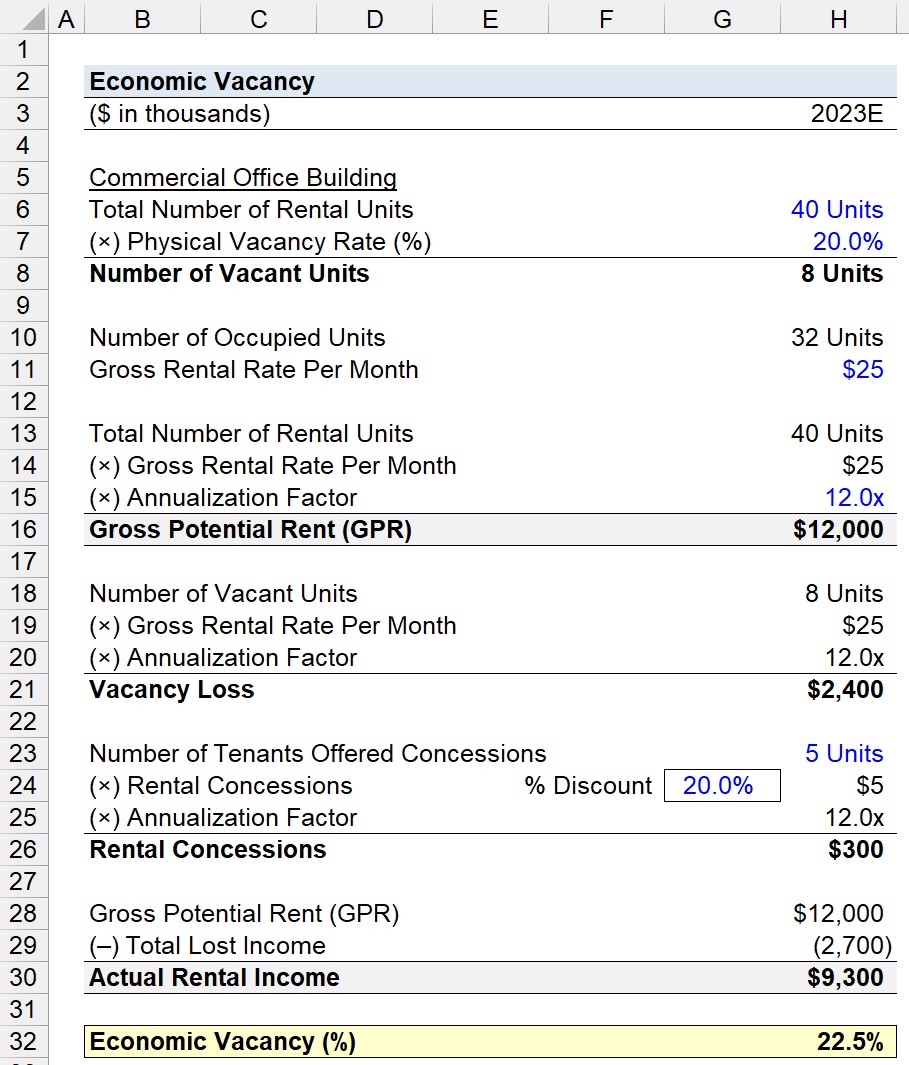
4. Economic Vacancy Calculation Example
In the final part of our exercise, the actual rental income must be determined by computing the difference between the gross potential rent (GPR) and the total income lost.
- Actual Rental Income = $12 million – $2.7 million = $9.3 million
Since we have the necessary formula inputs to calculate the economic vacancy, we can subtract the gross potential rent (GPR) from the actual rental income, which is $2.7 million.
The $2.7 million reflects the “spread” between the maximum rental income that could be generated and the property’s actual rental income.
The final step is to divide the $2.7 million by the gross potential rent (GPR) to arrive at an economic vacancy of 22.5%.
- Economic Vacancy (%) = $2.7 million ÷ $12 million = 22.5%
That said, the economy vacancy of 22.5% represents the rental income that the commercial office building could have retrieved if it had tenants in the vacant units and offered no concessions.
From a contrasting perspective, we could also divide the actual rental income by the gross potential rent (GPR) to quantify how close the commercial office building is to operating near its full capacity.
- $9.3 million ÷ $12 million = 77.5%
In conclusion, the sum of the two percentages that we calculated – 22.5% and 77.5% – equals 1.0 (or 100%) because the 22.5% economic vacancy measures the percentage of the gross potential rent (GPR) not earned, whereas the latter is the inverse and calculates the percentage of the GRP that the property managed to collect.