
- What is Cap Rate?
- How Does the Cap Rate Work?
- How to Calculate Cap Rate
- Cap Rate Formula
- Cap Rate Example
- How to Calculate NOI Using Cap Rate
- Implied Cap Rate vs. Actual Cap Rate: What is the Difference?
- What is a Good Cap Rate?
- Is a Higher Cap Rate Better?
- Cap Rate vs. Cash on Cash Return: What is the Difference?
- Cap Rate Expansion vs. Compression: What is the Difference?
- Cap Rate Calculator — Excel Template
- 1. Commercial Rental Property Investment Assumptions
- 2. Stabilized NOI Calculation
- 3. Real Estate Pro Forma Forecast
- 4. Cap Rate Calculation Example
- 5. Income Approach Appraisal (NOI / Cap Rate)
- 6. Cap Rate Sensitivity Analysis Matrix
What is Cap Rate?
Cap Rate—short for Capitalization Rate—is a measure of the expected rate of return on a real estate investment, such as a commercial rental property.
In simple terms, the cap rate converts one period of economic benefit, or net operating income (NOI), into an estimate of value.
Therefore, the cap rate is conceptually a function of the income potential of a rental property and the perceived risk attributable to the investment.
- The cap rate in real estate is a shorthand abbreviation for the term, “Capitalization Rate”.
- The cap rate is the expected return on a rental property based on its income potential and implied risk.
- The cap rate formula divides the net operating income (NOI) of a property by its current market value.
- The higher the cap rate, the higher the potential return and risk, all else being equal.
- There is no "good" cap rate per se since the target return is a subjective matter, but most commercial real estate (CRE) investors perceive cap rates around the 5% to 10% range as ideal.
- The shortcoming of the cap rate is the implicit assumption that the economic benefit retrieved in one period will continue in perpetuity.
How Does the Cap Rate Work?
The cap rate is a fundamental measure of risk and return in the commercial real estate (CRE) market.
Commercial real estate investors use the cap rate to establish the relative attractiveness of a particular property to determine whether the asking price is overpriced, underpriced, or priced fairly.
Therefore, the cap rate answers the fundamental question of, “For each dollar spent to acquire the property, what is the annual net operating income (NOI) expected to be generated?”
The cap rate formula compares the net operating income (NOI) of a real estate property investment to its fair value to quantify the anticipated rate of return.
In practice, the cap rate serves as the primary shorthand whereby properties of comparable risk and return can be analyzed side-by-side.
By converting the stabilized NOI of a property into a percentage, the implied cap rate is a standardized metric that facilitates fair comparisons between different properties (“apples-to-apples”).
Conceptually, a higher capitalization rate implies a higher potential return on investment (ROI) and more risk, whereas a lower cap rate coincides with a lower potential return but less risk.
The property value of a real estate asset can be derived from the capitalization rate since the metric reflects the expected yield on a property investment.
Given the implied property valuation, a real estate investor can estimate the purchase price to offer to acquire a property where the minimum required rate of return (or “hurdle rate”) is attainable.
How to Calculate Cap Rate
The cap rate is calculated by dividing a rental property’s net operating income (NOI) by its market value as of the present date.
- Net Operating Income (NOI) ➝ The NOI measures a property’s earnings potential based on its core income drivers, namely rent payments, minus its direct operating expenses (e.g., property taxes).
- Property Value ➝ The current market value, on the other hand, is the fair value of a property on the present date, albeit the purchase price can be used at times.
The step-by-step process to calculate the cap rate for a rental property investment is as follows:
- Step 1 ➝ Calculate Net Operating Income (NOI)
- Step 2 ➝ Estimate the Property Value (or Purchase Price)
- Step 3 ➝ Divide NOI by the Property Value
- Step 4 ➝ Convert into Percentage Form
Cap Rate Formula
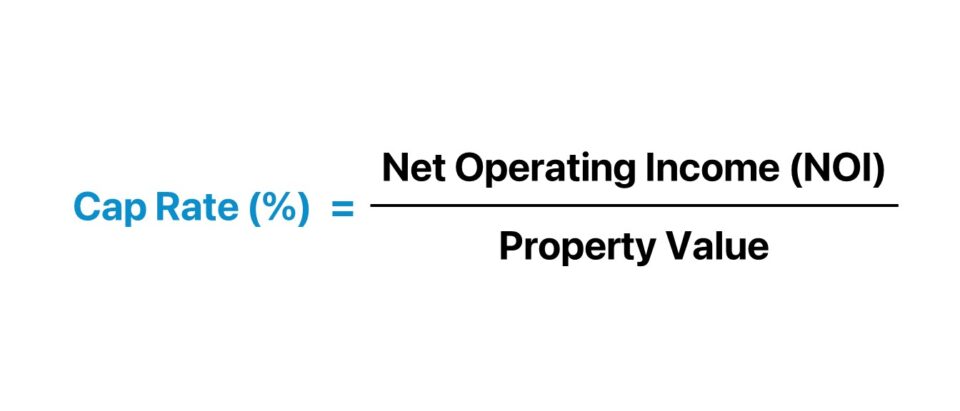
The formula for calculating the cap rate divides net operating income (NOI) by the market value of a property, as of the present date.
Cap Rate (%) = Net Operating Income (NOI) ÷ Property Value
Where:
The NOI component must reflect the pro-forma income the rental property expects to generate at stabilization (i.e. “steady-state”).
The term “stabilization” refers to the time at which the underlying property of a development project or strategic acquisition is considered complete.
The cap rate formula does not include mortgage payments or interest because of the logic that mortgage costs and interest expense charges are classified as financing costs (and, thus, not part of a property’s core operations).
Cap Rate Example
Suppose a commercial rental property is expected to generate $12 million in net operating income (NOI) in 2024, and comparable properties nearby are trading at a 6.0% market cap rate.
- Net Operating Income (NOI) = $12 million
- Market Cap Rate (%) = 6.0%
The 6% market cap rate reflects the annual percentage return on investment (ROI) on the rental property, assuming the property was purchased outright without financing.
The direct capitalization method, one of the core real estate appraisal techniques, states the value of a property can be estimated by dividing its stabilized NOI by the market cap rate.
Given the 6.0% market cap rate, the implied market value of the property is $200 million.
- Implied Property Value = $12 million ÷ 6.0% = $200 million
Since net operating income (NOI) and property value—the two variables in the cap rate formula—are known, we can solve for the cap rate by dividing the NOI by the property value.
- Cap Rate = $12 million ÷ $200 million = 6.0%
How to Calculate NOI Using Cap Rate
The relationship between net operating income (NOI) and the capitalization rate are closely intertwined.
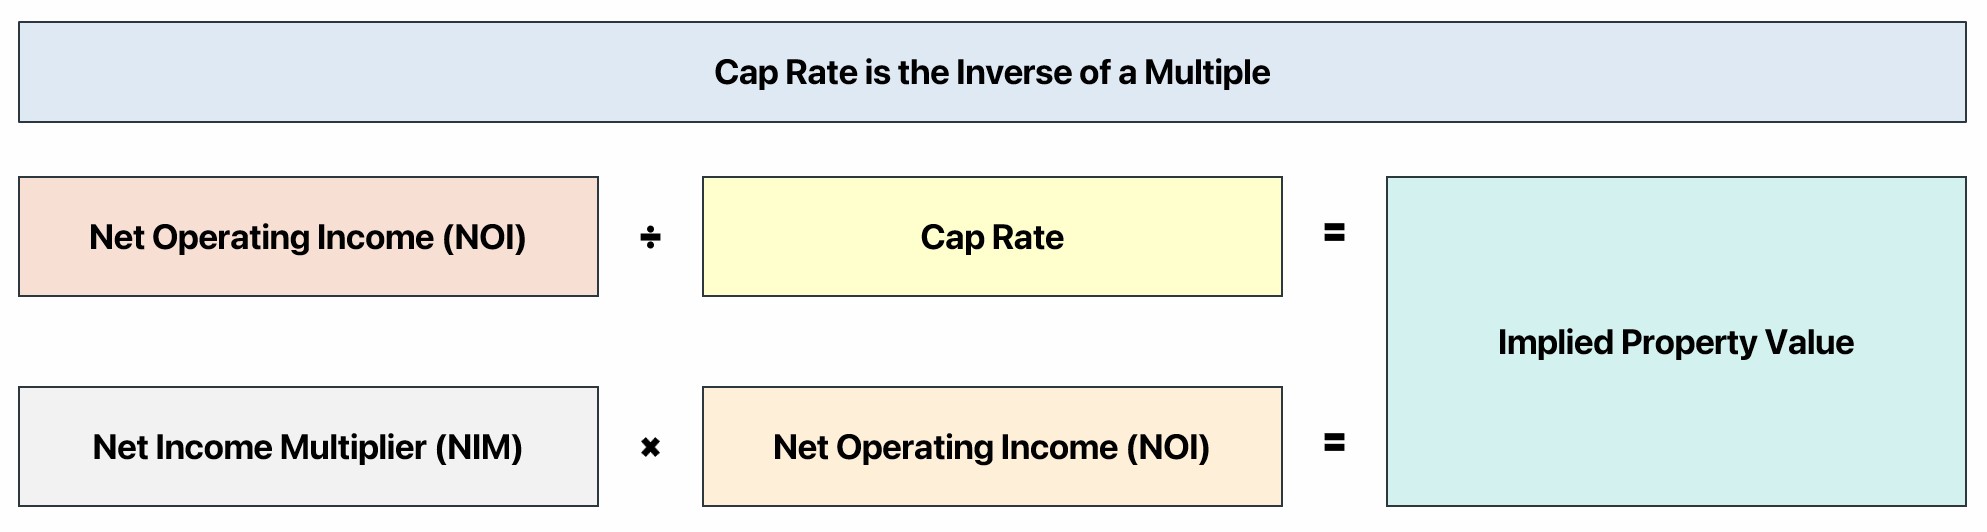
By rearranging the cap rate equation, we can derive the net operating income (NOI) of a property.
The formula to derive the cap rate from NOI involves multiplying the implied property value by the cap rate.
The cap rate is thereby the inverse of a multiple, such as EV/EBITDA.
The commonality between the two ratios is that each metric is composed of unlevered metrics—i.e. property value, net operating income (NOI), enterprise value (TEV) and EBITDA—because the two measure core operating performance.
Hence, the cap rate and EV/EBITDA are the industry-standard metrics to perform comparative analysis (or “comps”) in their respective fields.
Implied Cap Rate vs. Actual Cap Rate: What is the Difference?
One of the drawbacks of the cap rate is how the actual rental income can deviate from the projected income.
There are countless unforeseeable factors—both internal and external—such as unanticipated tenant vacancies and unfavorable market conditions (i.e. rising interest rates, economic recession).
On that note, the scope of the implied cap rate is limited since the return reflects a pro-forma estimate of the property’s income post-stabilization as of the date of analysis (Year 1).
Implied Cap Rate = Stabilized NOI ÷ Purchase Price
The property value component can either be the fair value of the real estate asset estimated via an independent property appraisal or the asking price set by the seller.
From the seller’s perspective, the actual cap rate is the historical NOI on a trailing twelve-month (TTM) basis divided by the realized sale price.
Actual Cap Rate = NOI at Exit ÷ Sale Price
The variance between the fair value and asking price on a given property reflects the subjective attribute of the cap rate, akin to the discount rate for corporate valuation.
The wider the “spread“ between the offer value and asking price, the greater the upside in potential return (or downside risk) for both the buyer and seller.
Hence, the necessity for both parties to negotiate an amicable purchase agreement (and sale price), where the “middle ground” is reached.
The Wharton Online and Wall Street Prep Real Estate Investing & Analysis Certificate Program
Level up your real estate investing career. Enrollment is open for the upcoming Wharton Certificate Program cohort.
Enroll TodayWhat is a Good Cap Rate?
The ideal cap rate is widely accepted as between 5% and 10% in the commercial real estate (CRE) market.
But of course, there are a broad number of factors, such as property type, classification, and asset class, that influence what a “good” cap rate is.
The primary reason interest rates matter is because the cost of borrowing (or debt) is affected.
The less equity required to be contributed to fund the property purchase price by the real estate investor, the higher the upside potential on the investment (and vice versa).
- Declining Interest Rate ➝ If the interest rates in the credit markets are reducing, real estate investors have more access to “cheap” capital with favorable borrowing terms (i.e. more buyer power and funds to finance CRE projects)
- Rising Interest Rate ➝ If interest rates are rising, the cost of capital is higher, so loans are priced at less favorable terms, reducing the expected return on a property investment.
Is a Higher Cap Rate Better?
The cap rate is a measure of returns, so the metric is also a measure of risk since risk and return are two sides of the same coin.
In short, the answer is rather nuanced and subject to the specific investment strategy, minimum required rate of return, and risk tolerance specific to the investor.
However, the notion that all real estate investors prefer a higher cap rate is misinformed.
Why? Certain real estate investors prioritize capital preservation—minimizing the risk of capital loss on an investment—whereas others are more yield-oriented and set a higher bar for the required rate of return.
- Higher Cap Rate ➝ Real estate properties with higher cap rates are perceived as riskier investments with less stability in their cash flow. However, the increased riskiness of the cash flows can be appealing to certain yield-oriented commercial real estate (CRE) investors, as the potential upside is greater.
- Lower Cap Rate ➝ On the other hand, real estate properties with lower capitalization rates are viewed as more conservative investments that generate stable income. Thus, risk-averse commercial real estate (CRE) investors are likely to find properties with steady income and situated in low-growth markets to be more attractive.
The trade-off here is that the predictability of the property’s NOI reduces the potential to earn an outsized yield above the original projection, barring unforeseen circumstances.
The risk tolerance varies by the specific investor, which goes hand-in-hand with the prior factor, as undertaking incremental risk must be compensated with a higher return.
Cap Rate vs. Cash on Cash Return: What is the Difference?
The difference between the cap rate and cash yield is as follows:
- Cap Rate ➝ The cap rate is the return expected on a rental property investment. Unlike the cash yield, the cap rate neglects the effects of financing (i.e. capital structure neutral) since the numerator is net operating income (NOI), an unlevered profitability metric unaffected by discretionary financing decisions. Therefore, the cap rate excludes financing costs such as interest and mortgage payments.
- Cash Yield ➝ The cash yield, or “cash on cash return,” is the annual pre-tax levered cash flow received per dollar of equity invested. In contrast to the cap rate, the cash yield is a levered metric (post-financing) because the debt service reduces the annual pre-tax cash flow.
The formula to calculate the cash yield consists of dividing the levered cash flow of a property by the equity investment contributed by the real estate investor.
Where:
- Levered Cash Flow = Net Operating Income (NOI) – Annual Debt Service
- Equity Contribution = Purchase Price – Total Debt
The levered cash flow is the rental income a property generates after deducting the annual debt service but before income taxes. The equity contribution is the cash investment (or “down payment”) the investor needs to close the real estate transaction.
The cap rate is a pro-forma measure of the implied return on an investment property as of the date of acquisition. In contrast, the constant denominator in the cash yield remains indifferent to the current state of the real estate market conditions, considering fixed purchase price and equity contribution.
The cash yield can determine the return earned on an equity investment on a rolling basis, where the percentage return fluctuates over time in tandem with the cash flow generated.
Since net operating income (NOI) neglects the effects of debt financing, the cap rate is better suited for comparative analysis, unlike the cash-on-cash return.
Cap Rate Expansion vs. Compression: What is the Difference?
The cyclically is an influential factor that directly impacts the property valuation of real estate assets in the broader market.
Based on the perceived risk, the investment strategies among buyers often pivot in response, wherein adjustments are applied per emerging market trends.
The investor sentiment at present is a continuously fluctuating external factor that affects market demand, with the potential to cause cap rates to rise or decline.
With that said, cap rate expansion coincides with falling property values, while cap rate compression implies rising property values.
- Cap Rate Expansion ➝ Cap rate expansion refers to market conditions where the potential return and risk on property investments are higher.
- Cap Rate Compression ➝ Conversely, cap rate compression occurs when the implied return (and risk) declines in the market, causing cap rates to reduce.
Cap Rate Calculator — Excel Template
We’ll now move on to a modeling exercise, which you can access by filling out the form below.
1. Commercial Rental Property Investment Assumptions
Suppose a commercial real estate (CRE) investment firm is analyzing a potential rental property investment opportunity with a current property value of $84 million.
- Property Value = $84 million
The pro-forma metrics for the commercial rental property investment—the strategic acquisition of an office building in NYC—at stabilization (Year 1) are as follows:
- Potential Gross Income (PGI) = $16 million
- Vacancy and Credit Losses = ($800k)
- Property Taxes = ($4 million)
- Property Management Fees = ($2.5 million)
- Property Insurance = ($2 million)
- Maintenance and Repairs = ($1.2 million)
- Other Direct Operating Expenses = ($500k)
2. Stabilized NOI Calculation
The effective gross income (EGI) of the property must be estimated as the first step toward determining the cap rate.
The $10 million difference between potential gross income (PGI) and vacancy and credit losses is the commercial rental property’s effective gross income (EGI).
- Effective Gross Income (EGI) = $16 million – $200k = $10 million
In the next step, we’ll deduct the operating expenses of the commercial real estate property to arrive at the property’s net operating income (NOI), which is $7.1 million.
- Net Operating Income (NOI) = $10 million – $1 million – $500k – $800k – $600k = $7.1 million
3. Real Estate Pro Forma Forecast
In our pro-forma forecast model, the property’s NOI at stabilization is estimated by subtracting direct operating expenses from effective gross income (EGI).
Where:
- Effective Gross Income (EGI) = Potential Gross Income (PGI) – Vacancy and Credit Losses
The consolidated pro-forma financial data for the commercial real estate (CRE) property investment are inserted into the following table to arrive at a net operating income (NOI) of $5 million.
| Pro-Forma Forecast | Year 1 |
|---|---|
| Potential Gross Income (PGI) | $16 million |
| (–) Vacancy and Credit Losses (5% Factor) | ($800k) |
| Effective Gross Income (EGI) | $15.2 million |
| (–) Property Taxes | ($4 million) |
| (–) Property Management Fees | ($2.5 million) |
| (–) Property Insurance | ($2 million) |
| (–) Maintenance and Repairs | ($1.2 million) |
| (–) Other Direct Operating Expenses | ($500k) |
| Net Operating Income (NOI) | $5 million |
4. Cap Rate Calculation Example
Since the property value was stated as an assumption earlier, whereas the NOI was calculated in the prior section, the required formula inputs to compute the implied cap rate are stated here:
- Net Operating Income (NOI) = $5 million
- Property Value = $84 million
By dividing the commercial real estate property’s net operating income (NOI) by the current property value, we arrive at a pro-forma cap rate of 6.0%.
- Pro-Forma Cap Rate (%) = $5 million ÷ $84 million = 6.0%
5. Income Approach Appraisal (NOI / Cap Rate)
In the next section, we’ll solve the estimated property value of the commercial real estate (CRE) property under the direct capitalization method.
The property value of the commercial office building was stated as an assumption earlier. Still, we can deliberately neglect that for the sake of illustrating the relationship between NOI and cap rate.
The stabilized NOI of the rental property is projected to be $5 million, while the capitalization rate is 6%.
Upon dividing our property’s net operating income (NOI) by the cap rate, we arrive at an implied property value of $84 million, which matches the original assumption stated at the start of our tutorial.
- Implied Property Value = $5 million million ÷ 6.0% = $84 million

6. Cap Rate Sensitivity Analysis Matrix
In the final part of our modeling exercise, we’ll complete the analysis of our hypothetical rental property investment by performing a sensitivity analysis (or “what-if” analysis).
The two variables selected in our sensitivity analysis matrix are net operating income (NOI) and purchase price, placed on the X-axis and Y-axis, respectively.
Our sensitivity matrix illustrates the relationship between net operating income (NOI) and purchase price, where a higher NOI and lower purchase price yield a higher cap rate (and vice versa).
- Higher NOI + Lower Purchase Price ➝ Higher Cap Rate
- Lower NOI + Higher Purchase Price ➝ Lower Cap Rate

")


