 Skip to main content
- What is Cost of Capital?
- How is Cost of Capital Used in Finance?
- Why Does the Cost of Capital Matter?
- Cost of Capital Formula
- How to Calculate Cost of Capital
- Cost of Capital vs. Cost of Equity: What is the Difference?
- How Does the Capital Structure Impact Cost of Capital?
- Cost of Capital Calculator
- 1. Cost of Debt Calculation Example
- 2. Cost of Equity Calculation Example
- 3. Cost of Capital Calculation Example
What is Cost of Capital?
The Cost of Capital is the minimum rate of return, or hurdle rate, required on a particular investment for the incremental risk undertaken to be rational from a risk-reward standpoint.
Fundamentally, the cost of capital reflects the opportunity cost to investors, such as debt lenders and equity shareholders, at which the implied return is deemed sufficient given the risk attributable to an investment.
How is Cost of Capital Used in Finance?
In corporate finance, the cost of capital is a central piece in analyzing a potential investment opportunity and performing a cash flow-based valuation.
In short, a rational investor should not invest in a given asset if there is a comparable asset with a more attractive risk-reward profile.
Conceptually, the cost of capital estimates the expected rate of return given the risk profile of an investment.
The cost of capital is contingent on the opportunity cost, where alternative, comparable assets are critical factors that contribute toward the specific hurdle rate set by an investor.
The decision to allocate capital toward a given investment and to risk incurring a monetary loss is economically feasible only if the potential return is deemed to be a reasonable trade-off.
Hence, the cost of capital is also referred to as the “discount rate” or “minimum required rate of return”.
Why Does the Cost of Capital Matter?
Suppose an investor commits to a particular investment, at a time when there are other less risky opportunities in the market with comparable upside potential in terms of returns.
Ultimately, the decision to proceed with the investment would be perceived as irrational from a pure risk perspective.
Why? The investor deliberately chose a higher-risk investment without the gain of further compensation for incremental risk, which is contradictory to the core premise of the risk-return trade-off.
The risk-return trade-off in investing is a theory that states an investment with higher risk should rightfully reward the investor with a higher potential return.
Therefore, the capital allocation and investment decisions of an investor should be oriented around selecting the option that presents the most attractive risk-return profile.
The cost of capital is analyzed to determine the investment opportunities that present the highest potential return for a given level of risk, or the lowest risk for a set rate of return.
Of course, quantifying the risk of an investment (and potential return) is a subjective measure specific to an investor. However, as a general statement, the more risk tied to a specific investment, the higher the expected return should be – all else being equal.
Cost of Capital Formula
The cost of capital is the rate of return expected to be earned per each type of capital provider.
In particular, two groups of capital providers contribute funds to a company:
- Equity Capital Providers → Common Shareholders and Preferred Stockholders
- Debt Capital Providers → Banks (Senior Lenders), Institutional Investors, Specialty Lenders (Mezzanine Funds)
The incentive to provide funds to a company, whether the financing is in the form of debt or equity, is to earn a sufficient rate of return relative to the risk of providing the capital.
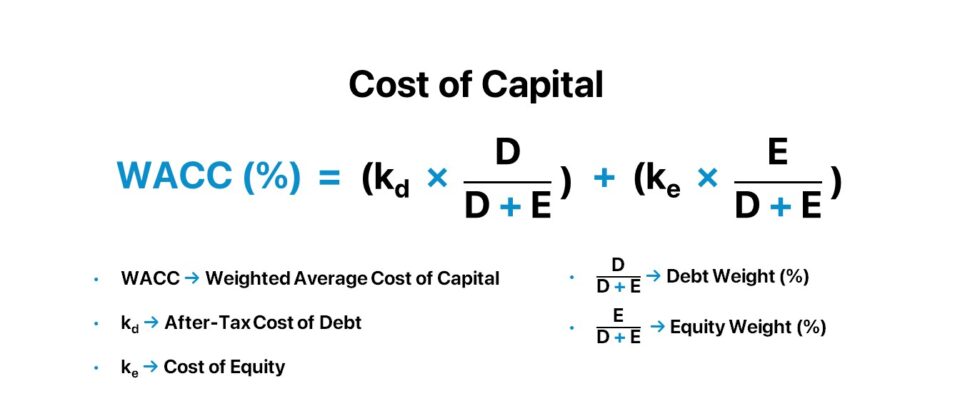
The weighted average cost of capital (WACC) is the rate of return that reflects a company’s risk-return profile, where each source of capital is proportionately weighted.
The formula to calculate the weighted average cost of capital (WACC) is as follows.
Where:
- WACC → Weighted Average Cost of Capital
- kd → After-Tax Cost of Debt
- ke → Cost of Equity
- D / (D + E) → Debt Weight (%)
- E / (D + E) → Equity Weight (%)
How to Calculate Cost of Capital
The step-by-step process to calculate the weighted average cost of capital (WACC) is as follows.
- Step 1 → Calculate After-Tax Cost of Debt (kd)
- Step 2 → Calculate Cost of Equity (ke) with the Capital Asset Pricing Model (CAPM)
- Step 3 → Determine the Capital Weights (%)
- Step 4 → Multiply Each Capital Cost by the Corresponding Capital Weight
- Step 5 → Sum of the Capital Structure Weight-Adjusted Capital Costs is the Cost of Capital (WACC)
One crucial rule to abide by is that the cost of capital and the represented stakeholder group must match.
The cost of capital metric and corresponding group of represented stakeholder(s) are each outlined here:
- Weighted Average Cost of Capital (WACC) → All Stakeholders, Including Debt, Common Equity, and Preferred Stock
- Cost of Equity (ke) → Common Equity Shareholders
- Cost of Debt (kd) → Debt Lenders
- Cost of Preferred Stock (kp) → Preferred Stockholders
Step 1. Calculate Cost of Debt (kd)
The starting point to compute a company’s weighted average cost of capital (WACC) is the cost of debt (kd) component.
The cost of debt (kd) is the minimum yield that debt holders require to bear the burden of structuring and offering debt capital to a specific borrower.
Conceptually, the cost of debt can be thought of as the effective interest rate that a company must pay on its long-term financial obligations, assuming the debt issuance occurs at present.
Or said differently, the cost of debt is the minimum required yield that lenders expect to receive on a financing arrangement, where there is adequate compensation for the potential risk of incurring a capital loss from providing debt to a specific borrower.
Estimating the cost of debt is relatively straightforward in comparison to the cost of equity since existing debt obligations such as loans and bonds have interest rates that are readily observable in the market via Bloomberg and other 3rd party data platforms.
Referencing the market-based yield from Bloomberg (or related resources) is the preferred option, and the pre-tax cost of debt can also be manually determined by dividing a company’s annual interest expense by its total debt balance.
The formula to calculate the pre-tax cost of debt, or “effective interest rate,” is as follows.
Since the interest paid on debt is tax-deductible, the pre-tax cost of debt must be converted into an after-tax rate using the following formula.
Contrary to the cost of equity, the cost of debt must be tax-affected by multiplying by (1 – Tax Rate) because interest expense is tax-deductible, i.e. the interest “tax shield” reduces a company’s pre-tax income (EBT) on its income statement.
The yield to maturity (YTM) on a company’s long-term debt obligations, namely corporate bonds, is a reliable estimate for the pre-tax cost of debt for issuers who are ascribed investment-grade credit ratings, which are determined by independent credit agencies (S&P Global, Fitch, and Moody’s).
Investment-grade debt is deemed to carry less credit risk and the borrower is at a lower risk of default; hence the designation of a higher credit rating.
Usually, the book value of debt is a reasonable proxy for the market value of debt, assuming the issuer’s debt is trading near par, instead of at a premium or discount to par.
The higher the cost of debt, the greater the credit risk and risk of default (and vice versa for a lower cost of debt).
The Wharton Online & Wall Street Prep Applied Value Investing Certificate Program
Learn how institutional investors identify high-potential undervalued stocks. Enrollment is open for the upcoming cohort.
Enroll TodayStep 2. Calculate Cost of Equity (ke)
The cost of equity (ke) is the minimum required rate of return for common equity investors that reflects the risk-reward profile of a given security.
If an investor decides to contribute capital to purchase an ownership stake in the common equity of a company, the cost of equity is the expected return on the security that should compensate the investor appropriately for the degree of risk undertaken.
The most common method to calculate the cost of equity (ke) by practitioners is via the capital asset pricing model (CAPM). The capital asset pricing model (CAPM) implies the expected rate of return on a security is a function of the underlying security’s sensitivity to systematic risk, which refers to the non-diversifiable component of risk.
The CAPM theorizes that the return on a security, or “cost of equity,” can be determined by adding the risk-free rate (rf) to the product of a security’s beta and equity risk premium (ERP).
The risk-free rate (rf) is most often the yield on the U.S. 10-year Treasury note on the date of the analysis.
The U.S. 10-year Treasury note is deemed risk-free since such issuances are backed by the “full faith and credit” of the U.S. government.
Given the unlikely scenario whereby the U.S. government is at risk of default, the government has the discretion to print more money to ensure it does not default on any of its financial obligations.
In corporate finance, beta measures the sensitivity of a specific security to the systematic risk of the broader market, i.e. the historical relationship of a particular company’s stock price movements relative to the overall market (e.g. S&P 500).
With that said, the higher the beta, the higher the cost of equity (and vice versa) — all else being equal. The risk associated with investing in a security can be segmented into two parts:
- Unsystematic Risk ➝ Unsystematic risk, or “company-specific risk,” can effectively be mitigated via portfolio diversification. Because unsystematic risk can be diversified, this form of risk is thus ignored in the calculation of beta.
- Systematic Risk ➝ In contrast, systematic risk, or “market risk,” is deemed to be non-diversifiable because the security’s price fluctuations (and sensitivity) to systematic risk cannot be diminished through portfolio diversification.
- Equity Risk Premium (ERP) ➝ The equity risk premium (ERP), often used interchangeably with the term “market risk premium,” is the incremental risk of investing in the stock market as opposed to risk-free securities issued by the government.
The CAPM states that equity shareholders require a minimum rate of return equal to the return from a risk-free security plus a return for bearing the “extra,” incremental risk. The extra risk component is equivalent to the equity risk premium (ERP) of the broader stock market multiplied by the security’s beta.
The formula to calculate the equity risk premium (ERP) is the difference between the expected market return and the risk-free rate, most often proxied by the yield on the 10-year Treasury note.
Historically, the equity risk premium (ERP) in the U.S. has ranged between 4.0% and 6.0%.
Step 3. Determine Capital Weights (%)
Once the cost of debt (kd) and cost of equity (ke) components have been determined, the final step is to compute the capital weights attributable to each capital source.
The capital weight is the relative proportion of the entire capital structure composed of a specific funding source (e.g. common equity, debt), expressed in percentage form.
To calculate the percent contribution of debt and equity relative to the total capitalization, the market values of debt and equity should be used to reflect the fair value rather than the book values recorded for bookkeeping purposes.
Why? A valuation is performed on a forward-looking basis, so using the current values per the open markets aligns more closely with the underlying objective.
The formula to calculate the capital weight for debt and equity is as follows.
- Debt Weight (%) = D ÷ (D + E)
- Equity Weight (%) = E ÷ (D + E)
Where:
- E → Market Value of Equity (MVE), i.e. Market Capitalization (or “Market Cap”)
- D → Market Value of Debt (or Book Value of Debt)
- (D + E) → Total Capitalization (Entire Capital Structure)
While the calculation of the market value of equity is relatively straightforward, since the process involves multiplying the company’s current stock price as of the latest closing date by its total number of diluted shares outstanding, the book value of debt is acceptable to use for the market value of debt input.
Barring unusual circumstances, the market value of debt seldom deviates too far from the book value of debt, unlike the market value of equity.
Cost of Capital vs. Cost of Equity: What is the Difference?
The weighted average cost of capital (WACC) is the blended required rate of return, representative of all stakeholders.
Hence, in an unlevered DCF model, the WACC is the appropriate discount rate to apply, as the rate must align with the cash flow metric in the represented stakeholder group(s).
In comparison, the cost of equity is the right discount rate to use in levered DCF, which forecasts the levered free cash flows of a company, as the two metrics are both attributable to solely equity shareholders.
- Cost of Capital (WACC) → Free Cash Flow to Firm (FCFF), or Unlevered Free Cash Flow
- Cost of Equity (ke) → Free Cash Flow to Equity (FCFE), or Levered Free Cash Flow
If there is no debt in a company’s capital structure, the cost of capital and the cost of equity will be equivalent.
How Does the Capital Structure Impact Cost of Capital?
The cost of equity is higher than the cost of debt because common equity represents a junior claim that is subordinate to all debt claims.
Because the interest expense paid on debt is tax-deductible, debt is considered the “cheaper” source of financing relative to equity.
So, why aren’t corporations financed entirely with debt?
The main drawback to debt financing is that it comes with fixed charges owed to the lender, namely interest and mandatory principal amortization, which causes the risk of default to rise – i.e. the addition of debt to the capital structure introduces the risk of financial distress and bankruptcy.
Corporations obtain financing from external capital providers, such as equity shareholders and debt lenders, to allocate the newly raised capital into investments that earn a rate of return (or yield) in excess of the cost of capital.
Because debt holders are of higher priority in the capital structure compared to equity holders – where in the event of default, lenders must receive full recovery and be repaid in full before equity holders can be distributed a portion of the proceeds, barring unusual circumstances – the expected risk and return from debt lenders is lower relative to equity investors.
In particular, senior debt lenders possess the most senior claim on the cash flows and assets belonging to the underlying company. Therefore, senior lenders – most often corporate banks – often tend to prioritize capital preservation and risk mitigation in lieu of a higher yield.
On the other hand, common equity is perceived to be the riskiest piece of the capital structure, as common shareholders represent the lowest priority class in the order of repayments.
But unlike debt securities, where the return is relatively fixed for the most part (i.e. via the collection of interest and repayment of the original principal in full at maturity), the potential upside in returns from investing in equity securities is “uncapped”.
The lower the cost of capital (WACC), the higher the present value (PV) of a company’s discounted future free cash flows (FCFs) – all else being equal.
In closing, the optimal capital structure is therefore the mix of debt and equity that minimizes a company’s cost of capital (WACC) while maximizing its firm valuation.
Cost of Capital Calculator
We’ll now move on to a modeling exercise, which you can access by filling out the form below.
1. Cost of Debt Calculation Example
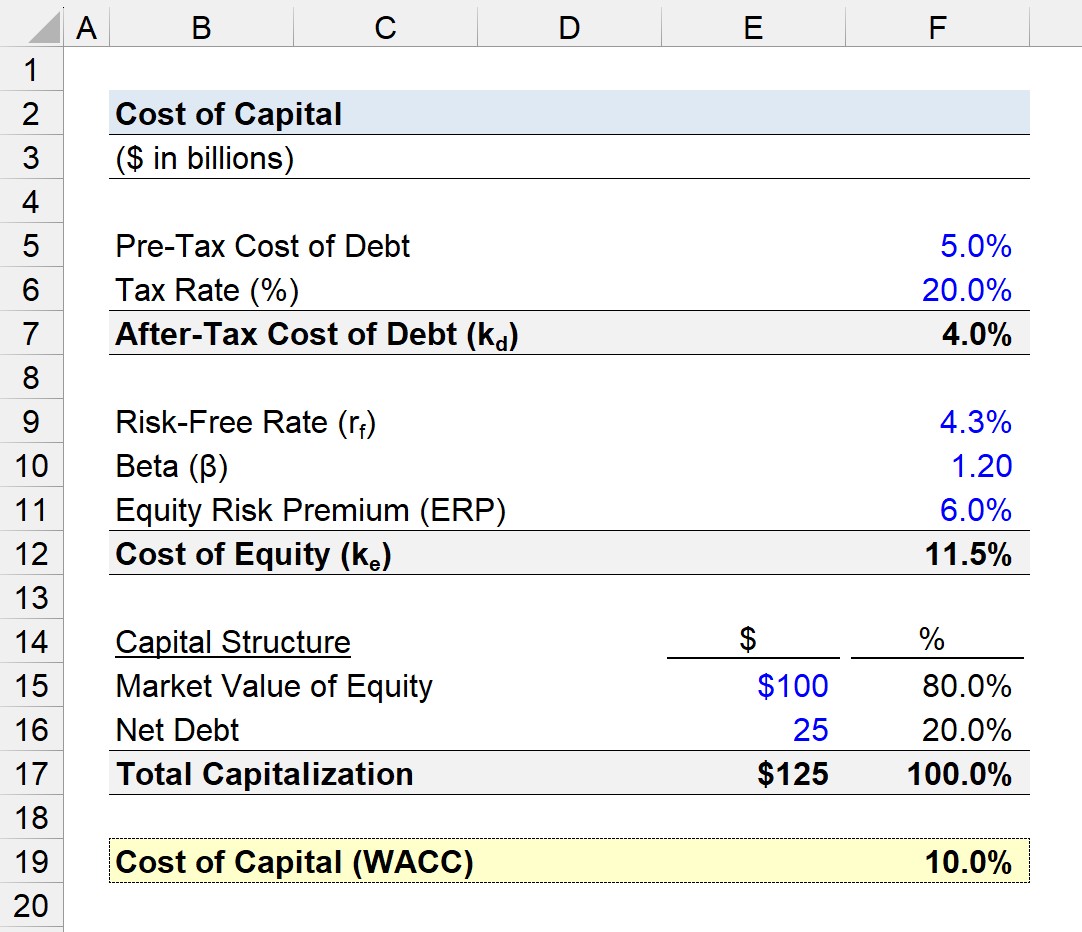
Suppose we’re tasked with estimating the weighted average cost of capital (WACC) for a company given the following set of initial assumptions.
- Pre-Tax Cost of Debt = 5.0%
- Tax Rate (%) = 20.0%
The first step toward calculating the company’s cost of capital is determining its after-tax cost of debt.
Since the pre-tax cost of debt was provided as an assumption, we’ll apply the 20.0% tax rate to compute the after-tax cost of debt, which comes out to be 4.0%.
- After-Tax Cost of Debt (kd) = 5.0% × (1 – 20.0%) = 4.0%
2. Cost of Equity Calculation Example
In the next step, the cost of equity of our company will be calculated using the capital asset pricing model (CAPM).
The three assumptions relevant to the CAPM are as follows:
- Risk-Free Rate (rf) = 4.3%
- Beta (β) = 1.20
- Equity Risk Premium (ERP) = 6.0%
The risk-free rate (rf) is the yield on the 10-year Treasury as of the present date.
The beta of 1.20 signifies the company’s equity securities are 20% riskier than the broader market. Therefore, if the S&P 500 were to rise 10%, the company’s stock price would be expected to rise 12%.
The equity risk premium (ERP) is the spread between the expected market return and the 4.3% risk-free rate, so the 6.0% risk premium implies the expected market return is approximately 10.3%.
- Market Return (mr) = 6.0% + 4.3% = 10.3%
Upon inputting those figures into the CAPM formula, the cost of equity (ke) comes out to be 11.5%.
- Cost of Equity (ke) = 4.3% + (1.20 × 6.0%) = 11.5%
3. Cost of Capital Calculation Example
In the final step, we must now determine the capital weights of the debt and equity components, or in other words, the percentage contribution of each funding source.
Often, practitioners use the net debt metric – i.e. total debt less cash and equivalents – rather than the gross debt figure while calculating the capital weights.
Why? The cash and cash equivalents sitting on a company’s balance sheet, such as marketable securities, can hypothetically be liquidated to help pay down a portion (or the entirety) of its outstanding gross debt.
The market value of equity will be assumed to be $100 billion, whereas the net debt balance is assumed to be $25 billion.
- Market Value of Equity = $100 billion
- Net Debt = $25 billion
While the market value of debt should be used, the book value of debt shown on the balance sheet is usually fairly close to the market value (and can be used as a proxy should the market value of debt not be available).
The sum of the $100 billion in equity value and $25 billion in net debt results in the total capitalization, which equals $125 billion.
- Total Capitalization = $100 billion + $25 billion = $125 billion
Of that $125 billion, we can determine the percent composition of the company’s capital structure by dividing each capital source’s value by the total capitalization.
- Equity Weight (%) = $100 billion ÷ $125 billion = 80.0%
- Debt Weight (%) = $25 billion ÷ $125 billion = 20.0%
In total, the sum of the equity and debt weights must equal 100% (or 1.0), which is true in our case (80% + 20% = 100%).
Since we have the necessary inputs to calculate our company’s cost of capital, the sum of each capital source cost can be multiplied by the corresponding capital structure weight to arrive at 10.0% for the implied cost of capital.
- Cost of Capital (WACC) = (4.0% × 20.0%) + (11.5% × 80.0%) = 10.0%

Everything You Need To Master Financial Modeling
Enroll in The Premium Package: Learn Financial Statement Modeling, DCF, M&A, LBO and Comps. The same training program used at top investment banks.
Enroll Today


