
What is Cost of Equity?
The Cost of Equity (ke) is the minimum threshold for the required rate of return for equity investors, which is a function of the risk profile of the company.
If an investor decides to contribute capital to the investment or project, the cost of equity is the expected return, which should compensate the investor appropriately for the degree of risk undertaken.

How to Calculate Cost of Equity
One simple method to think about the cost of equity is that it signifies the opportunity cost of investing in the equity of a specific company.
In other words, the cost of equity represents the “hurdle rate” that must be surpassed for an investor to proceed further with an investment.
For instance, if a company’s shares have a cost of equity of 8.0%, an investor should anticipate an ~8.0% return post-purchase. Simultaneously, comparable investments with similar risk profiles should yield similar returns – assuming the investor made a reasonable decision.
Since the cost of equity is the rate of return that an investor necessitates prior to investing in a particular company or taking on a project, it addresses the question of whether the potential return from the investment justifies the risk.
Additionally, along with the cost of debt and the cost of preferred stock, the cost of equity is a central piece in calculating the weighted average cost of capital (WACC).
Cost of Equity: What are the Full-Form Components?
The calculation of the cost of equity has three major components, which we’ll discuss in the coming sections:
Input 1. Risk-Free Rate (rf)
The risk-free rate (rf) typically refers to the yield on default-free, long-term government securities.
Theoretically, government-issued bonds are viewed as risk-free because if deemed necessary, the government could print more money at their discretion to avoid defaulting.
The current yield on the US 10-year note is the preferred proxy for the risk-free rate when it comes to valuing US-based companies.
The yield on government bonds can be found on various news sources – for example, the front page of the Wall Street Journal (WSJ).
In the chart posted below, we can observe the steady decline in the historical yield on the US 10-year note, especially around early 2020.
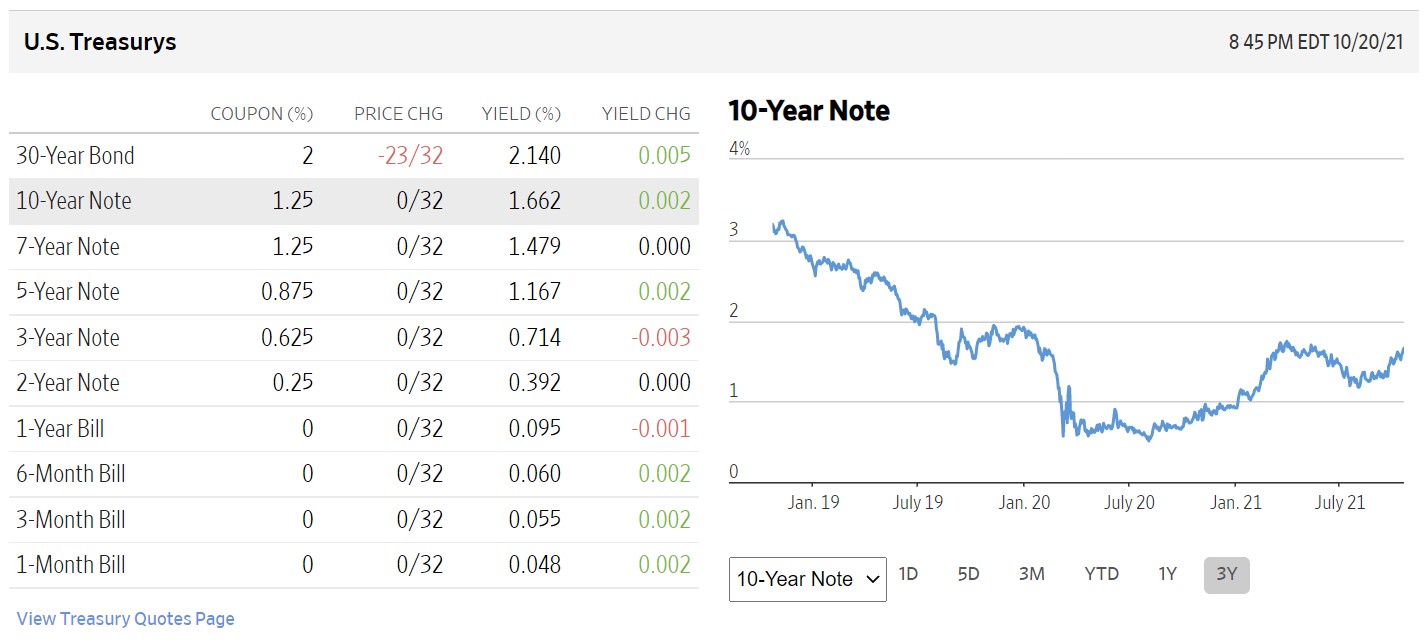
U.S. Treasury 10-Year Note 3-Year Historical Yields (Source: WSJ)
Input 2. Beta (β)
Beta is defined as the sensitivity of a specific security to the systematic risk of the market overall – or put differently, beta captures the relationship between the price movements of a particular company’s stock and the overall market (e.g. S&P 500).
The risk associated with beta can be bifurcated into two parts:
- Unsystematic Risk → Often called company-specific risk, unsystematic risk can be reduced via diversification and is therefore ignored
- Systematic Risk → On the other hand, systematic risk (or market risk) is referred to as “undiversifiable” risk – and as implied by the name, a company’s sensitivity to systematic risk cannot be decreased through diversification
As a general rule, the higher the beta, the higher the cost of equity (and vice versa).
Since systematic risk does not diminish even if the portfolio is further diversified, as a consequence, investors demand more compensation (i.e. higher potential returns) for assuming the extra risk.
The rationale is that greater volatility stemming from increased sensitivity to market fluctuations should result in higher potential investor returns.
Input 3. Equity Risk Premium (ERP)
The final component of the cost of equity calculation is called the equity risk premium (ERP), which is the incremental risk of investing in equities rather than risk-free securities, namely bonds.
Historically, the equity risk premium in the U.S. has ranged from around 4.0% to 6.0%.
Since the possibility of losing invested capital is substantially greater in the stock market in comparison to risk-free government securities, there must be an economic incentive for investors to place their capital in the public markets, hence the equity risk premium.
Cost of Equity Formula
Despite the widespread criticism from academia as well as practitioners, the capital asset pricing model (CAPM) remains the most prevalent approach for estimating the cost of equity.
The CAPM links the expected return on securities to their sensitivity to the broader market – typically with the S&P 500 serving as the proxy for market returns.
The formula to calculate the cost of equity (ke) is the risk–free rate plus the product of beta and equity risk premium.
Where:
- Risk-Free Rate (rf) → Yield on 10-Year Treasury Bond
- Beta (β) → Systematic Risk (Undiversifiable)
- Equity Risk Premium (ERP) → Expected Market Return (mr) Less Risk-Free Rate (rf)
Cost of Equity vs. Cost of Debt: What is the Difference?
In general, the cost of equity is going to be higher than the cost of debt.
The cost of equity is higher than the cost of debt because the cost associated with borrowing debt financing (i.e. interest expense) is tax-deductible, creating a tax shield – whereas, dividends to common and preferred shareholders are NOT tax-deductible.
Further, unlike lenders, equity holders have the lowest priority claim under a liquidation scenario because of their placement at the very bottom of the capital structure.
Note that the two concepts are closely interrelated, and raising more debt will impact not only the cost of debt but the cost of equity as the credit risk of the entire company is affected negatively. If more debt is incrementally added to the capital structure, the risk to all company stakeholders rises.
If a company carries no debt on its balance sheet, its cost of capital (WACC) will be equivalent to its cost of equity.
While early-stage, high-risk companies often do not have any debt, the vast majority of companies will eventually raise a moderate amount of debt financing once their operating performance stabilizes.
If a potential borrower has a track record showing historical profitability, banks and other lending institutions are far more willing to work with them (and provide more favorable lending terms).
If you’re building an unlevered discounted cash flow (DCF) model, the weighted average cost of capital (WACC) is the appropriate cost of capital to use when discounting the unlevered free cash flows.
Similar to unlevered free cash flows (FCFs), the WACC represents the cost of capital to all capital providers (e.g. common equity, preferred stock, debt).
But in the case of a levered DCF model, the cost of equity would be the correct cost of capital to discount the levered FCFs, as it captures the risk and expected returns to only equity holders.
Learn More → Cost of Equity by Industry (Damodaran)
How to Determine Optimal Capital Structure
Regarding the topic of the optimal capital structure, the vast majority of companies should be financed using a mixture of both debt and equity.
- Step 1 ➝ Declining WACC ➝ Initially, as the proportion of debt in the capital structure increases, WACC gradually decreases due to the tax-deductibility of interest expense (i.e., the “tax shield” benefits).
- Step 2 ➝ Optimal Capital Structure ➝ WACC continues to decrease until the “optimal” capital structure is reached. However, past this threshold, the cost of financial distress offsets the tax benefits of leverage, and the WACC reverses course.
- Step 3 ➝ Upward Trajectory ➝ Once the inflection point is reached, the cost of capital (WACC) starts an upward trajectory in which the risk to all stakeholders, including debt lenders and equity holders, increases at a rapid rate.
Cost of Equity Calculator
We’ll now move to a modeling exercise, which you can access by filling out the form below.
Cost of Equity Calculation Example
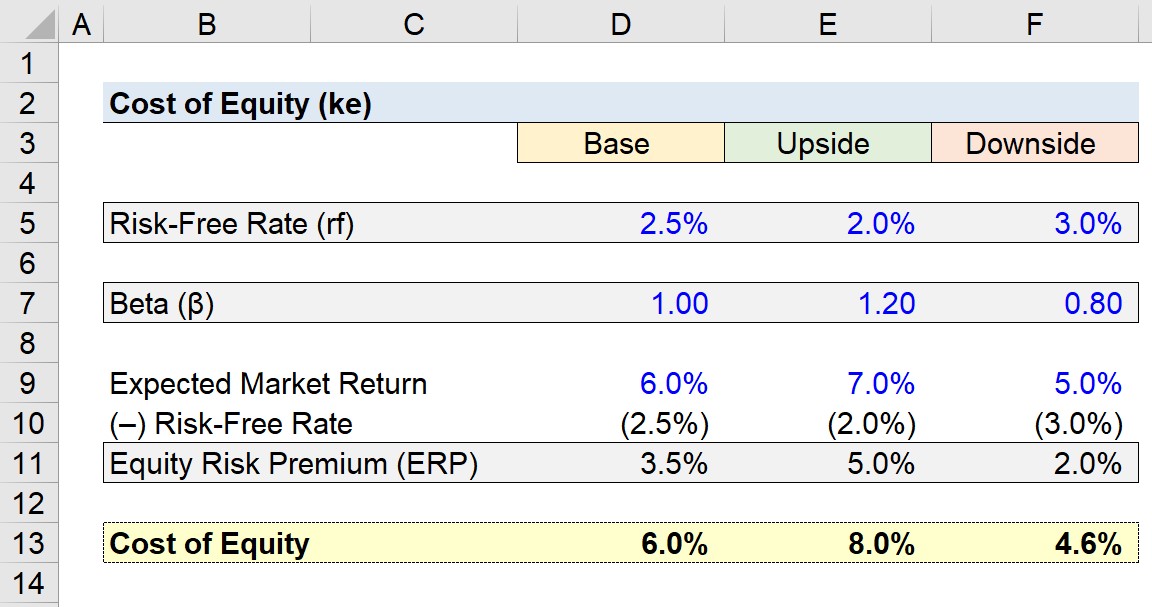
In our modeling exercise, we’ll be looking at three companies, each consisting of distinct values for the risk-free rate, beta, and equity risk premium.
Base Case Scenario
- Risk-Free Rate (rf) = 2.5%
- Beta (β) = 1.00
- Expected Market Return = 6.0%
Upside Case Scenario
- Risk-Free Rate (rf) = 2.0%
- Beta (β) = 1.20
- Expected Market Return = 7.0%
Downside Case Scenario
- Risk-Free Rate (rf) = 3.0%
- Beta (β) = 0.80
- Expected Market Return = 5.0%
For each scenario, if we subtract the risk-free rate from the corresponding expected market return, we get the equity risk premium (ERP).
- ERP, Base Case: 6.0% – 2.5% = 3.5%
- ERP, Upside Case: 7.0% – 2.0% = 5.0%
- ERP, Downside Case: 5.0% – 3.0% = 2.0%
The only remaining step is to input our assumptions into our cost of equity formula. The cost of equity under each scenario comes out to:
- Cost of Equity (ke), Base Case = 6.0%
- Cost of Equity (ke), Upside Case = 8.0%
- Cost of Equity (ke), Downside Case = 4.6%
The reason we titled each case as “Base”, “Upside”, and “Downside” is that we deliberately adjusted each of the assumptions in a direction that would either increase or decrease the cost of equity.
- Lower Risk-Free Rate (rf) → Higher Cost of Equity (ke)
- Lower Beta → Lower Cost of Equity (ke)
- Lower Equity Risk Premium (ERP) → Lower Cost of Equity (ke)
In closing, the drivers of the cost of equity are described above, while a screenshot of the completed output sheet has been posted below.

Everything You Need To Master Financial Modeling
Enroll in The Premium Package: Learn Financial Statement Modeling, DCF, M&A, LBO and Comps. The same training program used at top investment banks.
Enroll Today
")
")
")

