 Skip to main content
- What is Assets Under Management?
- What Does AUM Stand For?
- How to Analyze AUM by Industry?
- AUM in Private Equity Industry: Impact on LBO Fund Returns
- AUM in Hedge Fund Industry: Impact on Portfolio Returns
- Largest Hedge Funds by AUM – Excel Template
- BlackRock Assets Under Management (AUM): Investment Firm Example
- AUM vs. NAV: What is the Difference?
What is Assets Under Management?
Assets Under Management (AUM) refers to the market value of the capital contributed to a fund, from which an institutional firm invests on behalf of its clients, i.e. limited partners (LPs).

What Does AUM Stand For?
AUM stands for “Assets Under Management” and refers to the amount of capital managed by an investment firm on behalf of its clients, i.e. limited partners (LPs).
If applicable to the scenario, the limited partners (LPs) of a fund are the investors that collectively contribute capital to the fund, which is managed and deployed by the general partners (GPs) to generate a return.
Common examples of investment firms in the financial services industry where the AUM metric pertains include the following types:
- Private Equity (LBO)
- Hedge Fund (HF)
- Growth Equity (GE)
- Mutual Fund (MF)
- Venture Capital (VC)
- Real Estate
- Fixed Income
- Exchange Traded Funds (ETFs)
How to Analyze AUM by Industry?
The frequency at which the assets under management (AUM) change in industry-specific. Likewise, the method to calculate the metric is also distinct to each industry.
- Hedge Fund → A hedge fund’s AUM can move up or down based on the performance of its portfolio returns, i.e. the market value of the securities owned changes.
- Mutual Fund → A mutual fund’s AUM can be impacted by the inflows / (outflows) of capital in the fund, such as if an investor decides to provide more capital or remove some of their capital (or if the mutual fund issues dividends).
- Private Equity → A private equity firm’s AUM tends to remain more “fixed”, as capital raising occurs periodically with a set dollar amount raised. The actual AUM is typically unknown, as the actual market value of the investment is unknown until the date of exit (i.e. when the investment is sold via a sale to a strategic, a secondary buyout, or an IPO), contrary to the public equities market where securities trade constantly. In addition, there are lock-up periods in the agreements that can last long periods, where the limited partners (LPs) are prohibited from withdrawing funds.
The Wharton Online & Wall Street Prep Applied Value Investing Certificate Program
Learn how institutional investors identify high-potential undervalued stocks. Enrollment is open for the upcoming cohort.
Enroll TodayAUM in Private Equity Industry: Impact on LBO Fund Returns
The greater the assets under management (AUM), the more difficult it becomes for a private equity firm, i.e. financial sponsor, to achieve outsized returns because the number of potential investment opportunities declines and the capital at risk is greater.
Therefore, most if not all large institutional asset management firms are “multi-strat”, a catch-all term referring to firms that utilize diversified investment strategies, most often in separate investment vehicles.
Given the sheer magnitude of the capital managed, these institutional firms must become more risk-averse over time and diversify into various asset classes. Considering the wide range of strategies employed for diversification and risk management, the multi-strat approach offers more stability in returns in exchange for less risk and more downside protection, as each different fund strategy essentially functions as a hedge against all other funds.
For instance, a multi-strat firm can invest in public equities, bonds, private equity, and real estate to allocate the risk across different asset classes and overall de-risk its portfolio holdings.
Considering the fund’s AUM, capital preservation frequently takes priority over achieving outsized returns – albeit, certain funds might take a more aggressive approach to achieving higher returns, which is offset by the other strategies.
On the flip side, certain firms intentionally place a “cap” on the total amount of capital raised per fund to prevent their returns profile from deteriorating.
For example, it would be unusual for a lower middle market (LMM) private equity firm to compete with a mega-fund to acquire an LBO target valued around $200 million, as that range of valuation (and potential returns) is insufficient to interest larger firms.
In fact, even if PE firms in the lower middle market (LMM) space could raise more capital, their priority is typically achieving high returns for their LPs rather than maximizing their fund size, which coincides with a strategically determined cap on the amount to raise, as well as charging lower management fees (%).
AUM in Hedge Fund Industry: Impact on Portfolio Returns
Likewise, the top institutional hedge funds that manage billions in total capital, such as Point72, will also not invest in small-cap stocks, despite the fact that there are more opportunities for arbitrage and mispricing in the market.
The abundance of opportunities to capitalize on is due to reduced market liquidity (i.e. trading volume) and less coverage from equity research analysts and the press (e.g. media).
To reiterate from earlier, achieving excess returns becomes increasingly challenging as the assets under management (AUM) of a firm increase.
One reason is that it becomes near impossible for the hedge fund — an influential “market mover” here — to sell its stake (and realize its gains) without the stock price of the small-cap company declining, which effectively reduces its returns.
Each move by hedge funds is closely followed by the market, and the sheer dollar amount of their investments alone can cause the stock price of a small-cap company to move up or down.
If a large institutional hedge fund sells its shares, other investors in the market assume the firm – considering it has more connections, resources, and information – is selling its stake for a rational reason, possibly resulting in less buying interest from the broader market.
- Less Order Volume + Increased Selling → Lower Share Price
- High Order Volume + Decreased Selling → Higher Share Price
Therefore, the largest hedge funds in terms of AUM are limited to investing in only large-cap stocks. And since equity research analysts widely follow large-cap stocks and retail investors alike, those stocks tend to be more efficiently priced.
Largest Hedge Funds by AUM – Excel Template
Interested in accessing our comprehensive database of 400 hedge funds and investment firms in the public equities market?
Fill out the form below to download the Excel spreadsheet at no cost.
BlackRock Assets Under Management (AUM): Investment Firm Example
BlackRock (NYSE: BLK) is a global, multi-strategy investment firm and one of the largest global asset managers, with over $10 trillion in assets under management (AUM).
The screenshot below shows BlackRock’s AUM as of June 2022 segmented on the basis of:
- Client Type
- Investment Style
- Product Type
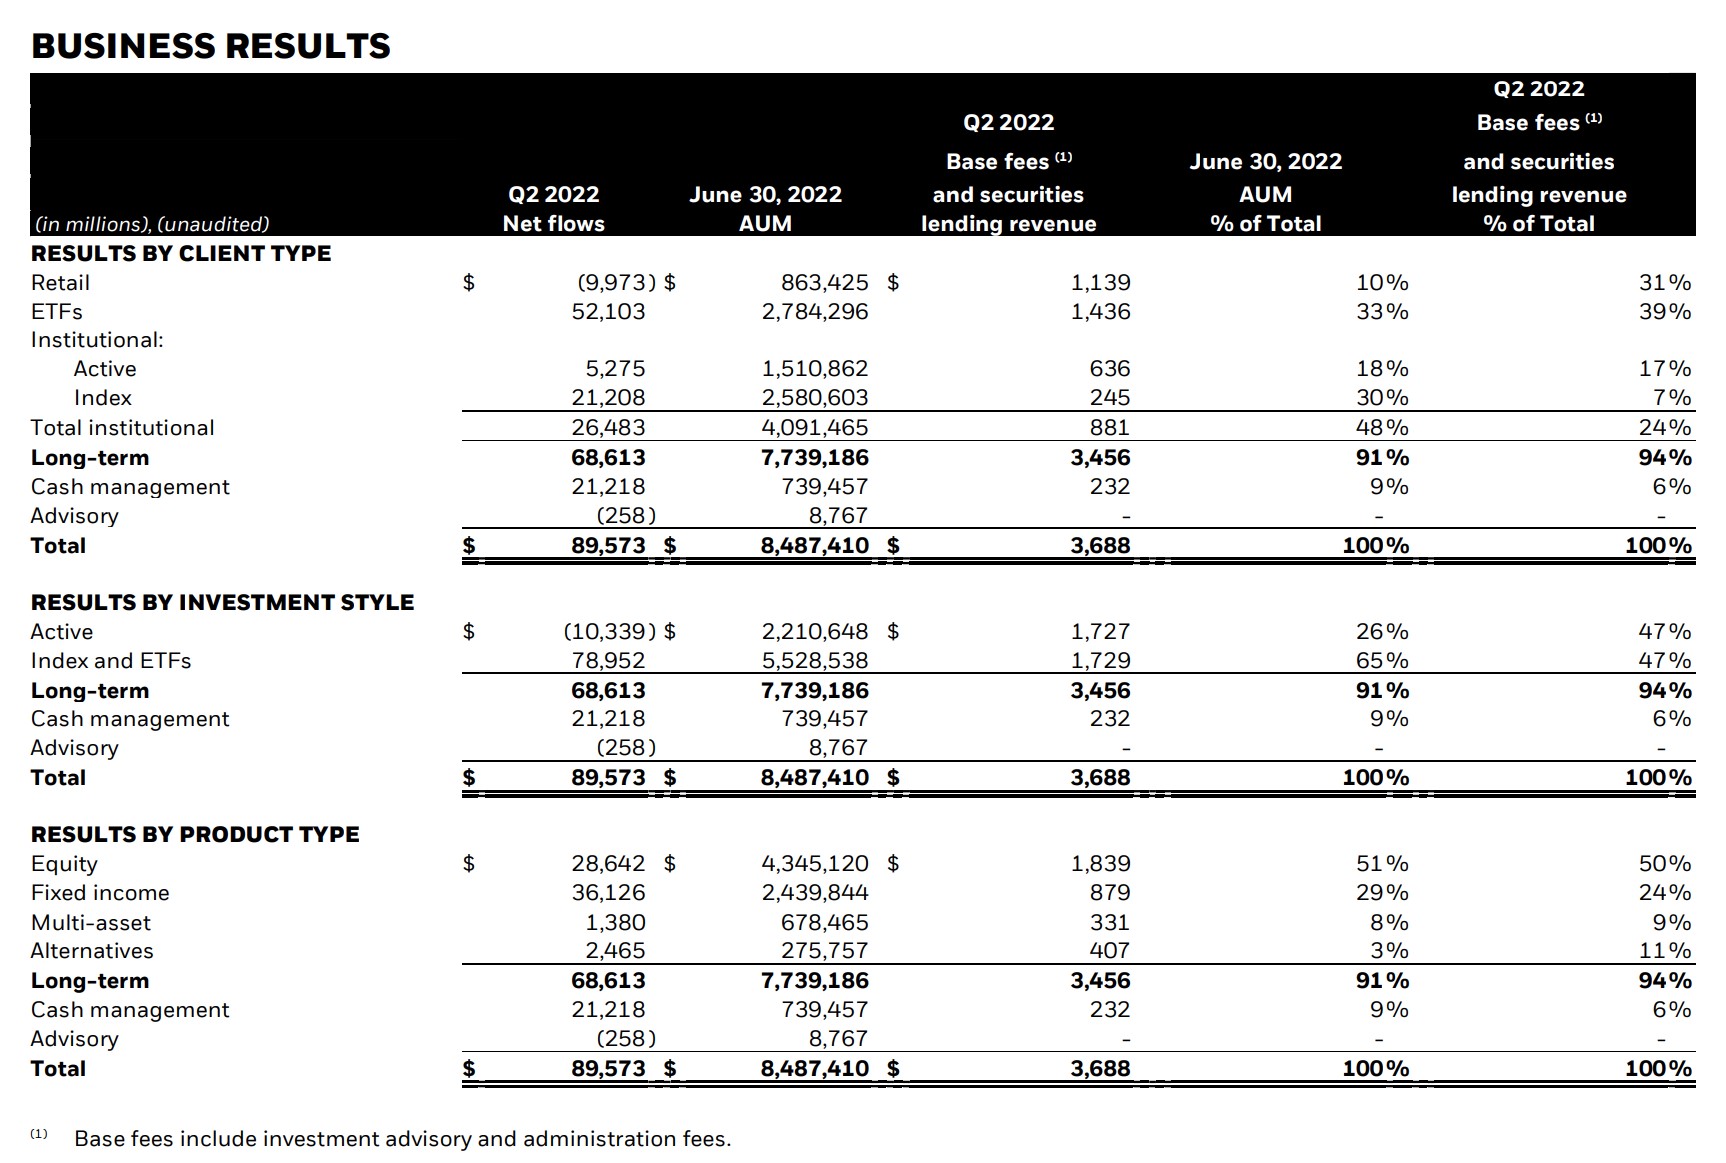
BlackRock Q2 2022 Earnings Release (Source: BlackRock)
AUM vs. NAV: What is the Difference?
A common misconception is that assets under management (AUM) and net asset value (NAV) are identical.
- Net Asset Value (NAV) → The NAV represents the total value of the asset’s managed by a fund after deducting fund liabilities. Further, the net asset value (NAV) is often expressed on a per-share basis, reflecting how the use case of the metric is more related to mutual funds and exchange traded funds (ETFs).
- Assets Under Management (AUM) → Unlike the net asset value (NAV), the AUM cannot be expressed on a per-share basis, at the risk of stating the obvious. Hypothetically, even if the AUM metric could somehow be standardized on a per-share basis, it would still be impractical given the returns distribution (i.e. J-Curve), among other factors.
To summarize, the assets under management (AUM) is the total value of assets managed by a firm — of which a significant portion could be sitting on the sidelines — as opposed to a mutual fund or ETF like the net asset value (NAV).


Any thought on whether it’s legit to compare fund NAV to AUM as a percentage? Like let’s say you want to describe what percent of an asset manager’s AUM is invested in a certain type of strategy: would you just sum the NAVs of the funds in that strategy bucket… Read more »
Hi, Robert,
I suppose it would give you the ratio for the assets after leverage (since NAV deducts liabilities) over total assets, which might be useful. As for various strategy buckets, I suppose either measure could in theory be divided across the various strategies of the firm.
BB