- What is MOIC?
- How to Calculate MOIC
- MOIC Formula
- What is a Good MOIC?
- AI for Better MOIC Analysis
- LBO MOIC Calculation Example
- Unrealized vs. Realized MOIC: What is the Difference?
- MOIC vs. IRR: What is the Difference?
- MOIC to IRR Table
- MOIC Calculator — Excel Template
- 1. LBO Model Entry Assumptions
- 2. LBO Returns Analysis Schedule
- 3. MOIC Calculation Example
- 4. MOIC Returns Analysis Example
What is MOIC?
MOIC stands for “Multiple on Invested Capital” and measures investment returns by comparing the value of an investment on the exit date to the initial equity contribution.
The MOIC is of particular importance to the private equity industry, where the metric is used to track the performance of an LBO investment and to perform a comparative analysis of a fund’s returns.
- The MOIC measures the return on an investment by comparing the value of an LBO investment at exit relative to the initial equity contribution.
- The MOIC formula is calculated by dividing the total cash inflows (e.g. exit value) by the total cash outflows (e.g. the initial equity contribution).
- A higher MOIC is perceived more positively since it indicates a more profitable investment, while a lower MOIC suggests the investment is unprofitable (and at risk of not meeting the target return).
- The MOIC reflects the growth in the value of an investment on an absolute basis, whereas the IRR represents the yield an investment generates on an annualized basis.
How to Calculate MOIC
The multiple on invested capital (MOIC) metric measures the value generated by an investment relative to the initial investment.
The term “MOIC” is interchangeable with several other terms, such as the “multiple on money (MoM)” and the “cash-on-cash return”.
Calculating the MOIC on an investment is generally straightforward, as the formula is simply the net cash return (“cash inflows”) divided by the initial cash contribution (“cash outflows”).
The multiple on invested capital (MOIC) is the ratio between two components, which determines the gross return.
- Cash Inflows ➝ Initial Capital Investment (e.g. Equity Contribution at Entry)
- Cash Outflows ➝ Exit Value of the Risky Asset (e.g. LBO Target Company at Sale)
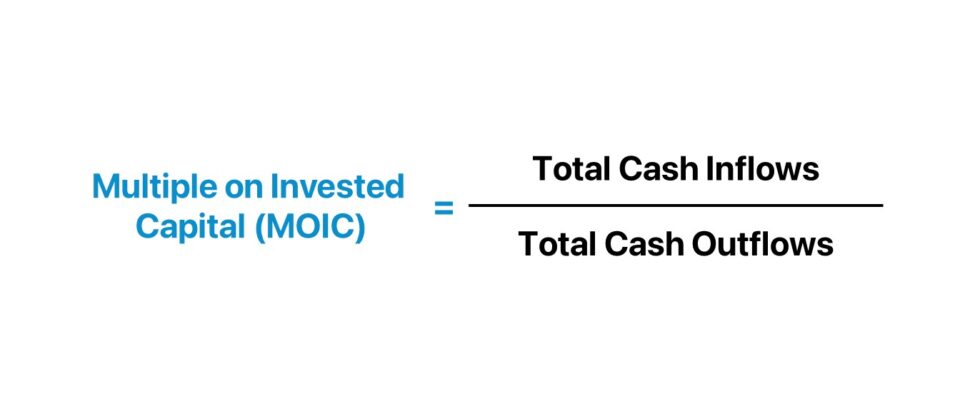
MOIC Formula
The formula for calculating the multiple on invested capital (MOIC) on an investment is as follows.
Where:
- Total Cash Inflows ➝ In the context of an LBO, the cash inflows stem from events such as the completion of a dividend recapitalization and a liquidity event, e.g. sale to a strategic or initial public offering (IPO).
- Total Cash Outflows ➝ The cash outflows consist of namely one major item: the initial equity contribution that had been required to complete the buyout. Often, the outflow component will be displayed as a negative number in Excel, so an additional negative sign must be placed in front of the formula to work, i.e. to convert to a positive figure.
What is a Good MOIC?
The multiple on invested capital (MOIC) essentially represents the returns earned per dollar of initial investment contributed.
- High MOIC → Higher MOIC is perceived positively because it is implied that the investments are profitable.
- Low MOIC → Lower MOIC is viewed negatively as it means that the investment is unprofitable (and investors are at risk of not receiving their target return or even recoup their initial capital).

AI for Better MOIC Analysis
Multiple on Invested Capital (MOIC) provides a simple snapshot of investment returns, but it may miss key factors like timing and market context. Artificial intelligence improves MOIC analysis by quickly processing large volumes of historical data, benchmarking against comparable investments, and uncovering hidden trends or risks. Wall Street Prep and Columbia Business School Executive Education launched the AI for Business & Finance Certificate Program to help professionals enhance their investment analysis skills using cutting-edge AI technologies. This training program equips users to optimize financial strategies and refine decision-making models using data-driven insights.
LBO MOIC Calculation Example
For example, imagine that a private equity firm (i.e. a financial sponsor) invested $20 million to fund the purchase of an LBO target.
If the post-exit return at the end of the holding period, Year 5, is $80 million, the MOIC on the investment is 4.0x.
- Initial Capital Investment = $20 million
- LBO Exit Proceeds in Year 5 = $80 million
- MOIC = $80 million ÷ $20 million = 4.0x
In other words, each $1.00 of invested capital contributed by the private equity firm grew to $4.00 over the five-year period.
The Wharton Online and Wall Street Prep Private Equity Certificate Program
Level up your career with the world's most recognized private equity investing program. Enrollment is open for the upcoming cohort.
Enroll TodayUnrealized vs. Realized MOIC: What is the Difference?
When evaluating overall fund performance, i.e. multiple assets in a portfolio, the formula uses different inputs, but the core concepts remain the same.
The classification of MOIC can be expressed on either an unrealized or realized basis.
- Unrealized MOIC → The return is inclusive of investments in the portfolio not yet sold, i.e. the expected profits post-sale are not certain (and still at risk of fluctuations).
- Realized MOIC → The return calculation is composed only of “realized” investments in the portfolio, where the profits have been locked in.
MOIC vs. IRR: What is the Difference?
The multiple on invested capital (MOIC) and internal rate of return (IRR) are the two most common performance metrics used in the private equity industry.
- MOIC → The ratio between an investment’s ending (future) value to the initial investment size.
- IRR → The annualized rate of return earned on the investment.
MOIC measures the amount earned, whereas the IRR considers not only the total earnings from the investment but also the time required.
A higher MOIC ratio implies a more profitable investment, whereas a lower MOIC indicates the investment is less profitable.
One notable distinction between MOIC and IRR is the consideration of time, i.e. the holding period of the investment.
While MOIC may require less time and financial data to calculate, the metric simply focuses on the gross return earned on the date of the exit, regardless of when that exit occurred.
The fact that the MOIC metric neglects the concept of time is the reason the internal rate of return (IRR) – i.e. a returns metric that considers the duration of the holding period – must be calculated as well to generate a complete picture of investment performance, inclusive of the passage of time.
In contrast, an investment’s IRR can vary substantially under different exit date assumptions, as longer holding periods tend to cause returns to decline (and short exits can misleadingly increase the IRR).
The sensitivity of the IRR to the exit date is one drawback to the metric, which reflects again the importance of using more than one metric to understand the full picture.
Private equity investors must, therefore, pay close attention to both the MOIC and IRR, as the two are complimentary rather than mutually exclusive.
MOIC to IRR Table
For those preparing for private equity interviews – especially for the paper LBO – it is highly recommended to memorize the most common MOIC to IRR approximations.
| MOIC | Implied IRR |
|---|---|
|
|
|
|
|
|
|
|
|
|
|
|
MOIC Calculator — Excel Template
We’ll now move to a modeling exercise, which you can access by filling out the form below.
1. LBO Model Entry Assumptions
Suppose a company underwent an LBO acquisition on 12/31/21, marking the end of 2021.
In order to acquire the target company, the private equity firm (or financial sponsor) needed to contribute $100 million in cash, i.e. the sponsor’s equity contribution.
Our LBO returns schedule must reflect the initial cash outlay of $100 million in Year 0 – which, for illustrative purposes, was formatted with red as the font color.
- LBO Transaction Closing Date = 12/31/21
- Sponsor Equity Contribution (and Initial Cash Outlay) = $100 million
The MOIC metric has its limitations and must be used in conjunction with the IRR, so we’ll calculate the two return metrics side-by-side.
2. LBO Returns Analysis Schedule
The “Cash Inflow / (Outflow)” is determined by our “% Recovery of Initial Investment” assumption in the LBO holding period, i.e. the five-year forecast period.
The recovery percentages are assumed to be 100% in Year 1, followed by an annual increase of 50% each year until Year 5, the end of the holding period.
Therefore, the net cash inflows (and outflows) are as follows.
- Year 0 = –$100 million
- Year 1 = $100 million
- Year 2 = $150 million
- Year 3 = $200 million
- Year 4 = $250 million
- Year 5 = $300 million
Except for Year 0 – the date of the LBO – all the other years represent net positive values to the sponsor.
Hence, the IRR is 0%, and MOIC is 1.0x in Year 0, which means the return was neutral and the full initial investment was recouped.
In reality, transactions such as LBOs can easily accumulate incremental fees for M&A advisory fees from investment banks and legal fees, so the 1.0x MOIC would most likely have been a net loss of capital for the firm after taking into consideration any expenses.
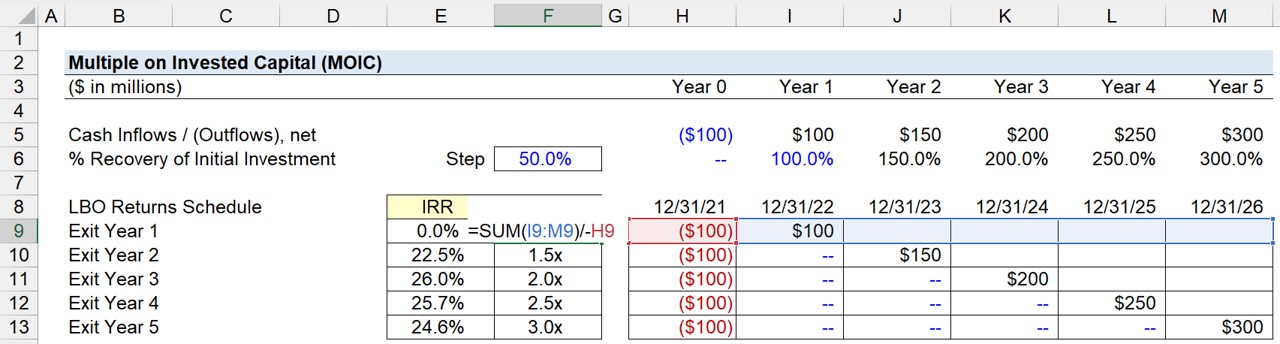
3. MOIC Calculation Example
The process of calculating the internal rate of return (IRR) in Excel involves using the “XIRR” function, wherein the first array is a row of dates (Row 8) and the second array is the “Cash Inflows / (Outflows), net” (Row 5).
The multiple on invested capital (MOIC) is calculated by adding the cash values received during the holding period, starting from Year 1.
The next step is to divide the sum from above by the initial investment amount, with a negative sign placed in front of the initial investment value (to convert it to a positive value).
For example, the MOIC assuming a Year 1 exit is 1.0x.
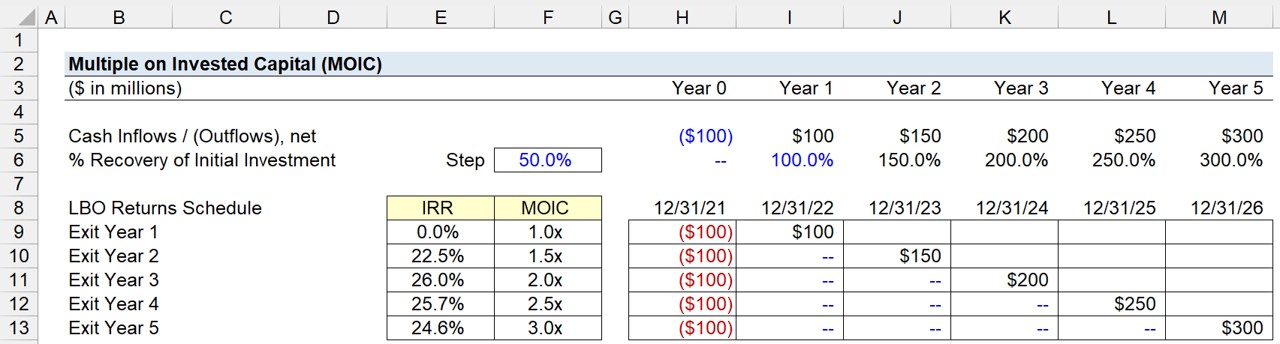
4. MOIC Returns Analysis Example
The completed returns schedule from our hypothetical LBO scenario is as follows.
| Exit Year | IRR | MOIC |
|---|---|---|
| Year 1 Exit | 0.0% | 1.0x |
| Year 2 Exit | 22.5% | 1.5x |
| Year 3 Exit | 26.0% | 2.0x |
| Year 4 Exit | 25.7% | 2.5x |
| Year 5 Exit | 24.6% | 3.0x |
Assuming the financial sponsor exited the investment in Year 5, the estimated IRR is 24.6%, while the MOIC is 3.0x.
- Implied Internal Rate of Return (IRR) = 24.6%
- Multiple of Invested Capital (MOIC) = 3.0x
In closing, the implied MOIC of 3.0x reflects a favorable outcome on the LBO investment to the private equity firm, considering the initial equity contribution tripled in value over the five-year period.