Skip to main content
What is Average Cost?
The Average Cost, or “per unit cost”, is an economic term that describes the approximate cost incurred to manufacture one production unit.
How to Calculate Average Cost (Per Unit Cost)
The average cost represents the standard cost incurred per unit of production.
The calculation of the average cost is relatively straightforward, since the per-unit cost represents the ratio between the total cost of production and the total number of production units.
The importance of measuring the average cost is tied to setting the pricing of products appropriately, wherein enough profits are generated per sale for the company’s operations to remain sustainable.
In theory, the price point at which a good is sold should be based on the current state of the market conditions (i.e. supply and demand), which is a fundamental part of researching a particular market, target customer profile, and business model optimization.
The process of determining a company’s average cost is as follows.
- Step 1 → Count the Total Number of Units Produced in a Given Period
- Step 2 → Determine the Total Production Costs Incurred in the Corresponding Period
- Step 3 → Divide the Total Cost of Production by the Total Number of Units Produced
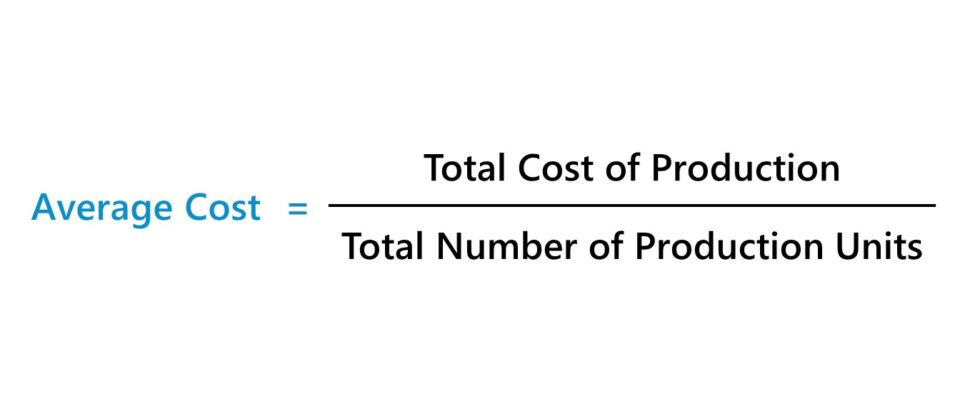
Average Cost Formula (Per Unit Cost)
The formula to calculate the average cost is as follows.
Broadly, the total cost of production is composed of two parts, as expressed by the following formula.
While the total cost of production is often abbreviated as “TC”, the total number of units produced is frequently denoted as “Q”.
The Wharton Online & Wall Street Prep Applied Value Investing Certificate Program
Learn how institutional investors identify high-potential undervalued stocks. Enrollment is open for the upcoming cohort.
Enroll TodayMarginal Cost Analysis: Fixed Cost vs. Variable Cost Per Unit
The total cost of production can be segmented into two distinct types of costs, which are differentiated by their relationship (or lack thereof) with the volume of output.
- Fixed Cost → Fixed costs remain the same irrespective of the production volume, i.e. they are independent of the unit output.
- Variable Cost→ Variable costs fluctuate based on the output of production, i.e. an increase in production volume coincides with higher variable costs (and vice versa).
Initially, the average cost tends to decline as more units are produced—i.e. economies of scale—but the cost savings and benefits to a company’s profit margins reverse course beyond a certain threshold in terms of unit production output.
Near the aforementioned inflection point, most of the incurred incremental per-unit costs are of variable nature, rather than fixed costs. Therefore, companies must establish set internal targets regarding the number of units to produce (and sell to the market) in order to operate at a level where profitability is near maximized.
Otherwise, the positive effects of economies of scale start to diminish as the marginal benefit derived from the production of each incremental unit declines (and the marginal cost per unit causes profits to decline).
- Marginal Cost < Average Cost: Increased Production Output → Lower Average Cost
- Marginal Cost > Average Cost: Decreased Production Output → Higher Average Cost
Average Cost Calculator – Excel Template
We’ll now move on to a modeling exercise, which you can access by filling out the form below.
Average Cost Calculation Example (Per-Unit Cost)
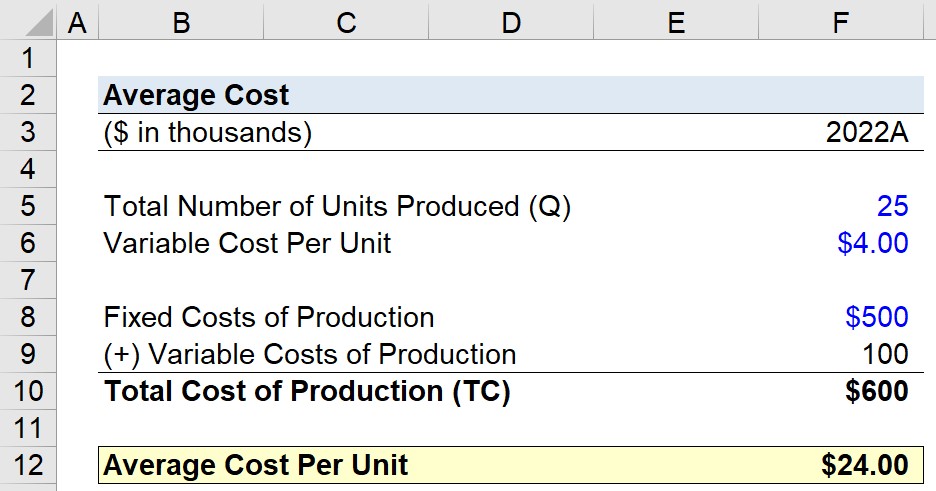
Suppose an OEM equipment manufacturer produced a total of 25,000 parts and components in the fiscal year ending 2022.
Amid the conversion of raw materials it purchased into finished goods ready to be sold to its customers, the manufacturer incurred a total of $500,000 in fixed costs.
- Total Number of Units Produced (Q) = 25,000
- Total Fixed Costs = $500,000
Moreover, the variable cost per unit of production is $4.00, so the total variable costs incurred over the course of the fiscal year were $100,000.
- Variable Cost Per Unit = $4.00
- Total Variable Costs = $4.00 × 25,000 = $100,000
The sum of the manufacturer’s fixed and variable costs, i.e. the total cost of production, comes out to $600,000.
- Total Cost of Production (TC) = $500,000 + $100,000 = $600,000
In the final step of our exercise, the total cost of production is divided by the total quantity of units produced to arrive at an average cost of $24.00.
- Average Cost Per Unit = $600,000 ÷ 25,000 = $24.00