- What is Average Total Cost?
- How to Calculate Average Variable Cost
- Average Total Cost Formula
- What is the Shape of the Average Total Cost Curve?
- Average Total Cost vs. Marginal Cost: What is the Difference?
- Average Total Cost Calculator
- 1. Cost Structure Assumptions
- 2. Average Total Cost Calculation Example
What is Average Total Cost?
The Average Total Cost (ATC) is the total cost per unit of output, inclusive of both fixed costs and variable costs. Therefore, the average total cost, often abbreviated as “average cost” for short, is the per-unit cost of producing a product.
How to Calculate Average Variable Cost
The average total cost is the total cost of production, or sum of fixed and variable costs, divided by the total quantity of output.
The average total cost (ATC) is an economic term that refers to the total cost of production, expressed on a per-unit basis.
In practice, the average total cost (ATC) is a method used to determine the breakeven price, which is the minimum price the company can charge to receive no income or loss.
There are two components in a company’s cost structure (and total costs) – the fixed cost (FC) and variable cost (VC) – which represent the total cost of production incurred by the company.
- Fixed Costs (FC) → Fixed costs remain constant irrespective of the quantity of output or production level, particularly in the near term (e.g. rent, insurance, utilities).
- Variable Costs (VC) → Variable costs, on the other hand, continuously fluctuate based on the quantity of output (e.g. direct labor, direct material).
In short, fixed costs are independent of the quantity of output, while variable costs increase (or decrease) in tandem with the current level of output.
The fixed cost, variable cost, and total cost measure distinct parts of the cost of production in monetary terms. However, the average fixed cost, average variable cost, and average total cost are standardized into per-unit measures.
Once the total cost (TC) is divided by the quantity of output (or production units), the resulting figure is the average total cost (ATC).
Therefore, the method to calculate the average total cost (ATC) comprises three steps:
- Determine the Total Quantity of Output (or Production Units)
- Calculate the Total Cost (Fixed Cost + Variable Cost)
- Divide the Total Cost (TC) by Total Quantity (Q)
Average Total Cost Formula
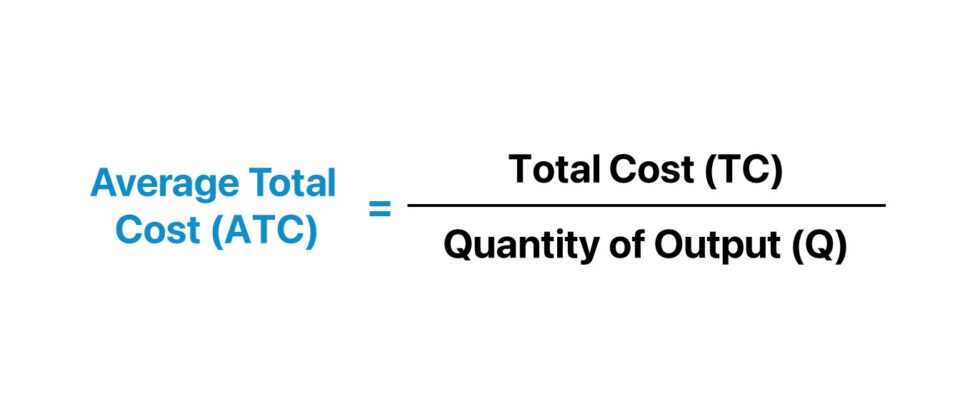
The formula to calculate the average total cost is as follows.
The total cost is determined by adding a company’s fixed costs to the product of its variable cost per unit and the quantity of output.
On the other hand, the quantity of output is the number of units produced in the coinciding period.
The Wharton Online & Wall Street Prep Applied Value Investing Certificate Program
Learn how institutional investors identify high-potential undervalued stocks. Enrollment is open for the upcoming cohort.
Enroll TodayWhat is the Shape of the Average Total Cost Curve?
If graphed, the average total cost curve is U-shaped, because the average cost declines amid a period of low output and rises from increased output.
The business model of a company is viable only if the monetary benefits obtained from production can consistently exceed the sum of its fixed costs and variable costs over the long term.
With that said, the average total cost is akin to a minimum hurdle rate, as the monetary benefit retrieved from customers must exceed the average cost.
Otherwise, the company incurs a loss, which happens when the payment value is insufficient to reach the break-even point (BEP), which is not sustainable over the long term.
In the short run, fixed costs are seldom easy to adjust, while variable costs can usually be promptly reduced if deemed necessary.
The total fixed cost component is constant. In effect, the average fixed cost per unit initially declines from an increase in output production (i.e. the “spreading effect”).
If illustrated on a graph, the average total cost curve is U-shaped (or upward-sloping) in most cases.
- Initially, the average total cost starts relatively high, since fixed costs constitute the most significant proportion of the cost structure.
- The average total cost, however, descends as the company expands in scale (and increases in quantity of output).
- Given the increase in output, the fixed cost burden is “spread” across an increased quantity of output.
- The marginal benefit of continued expansion declines with time because of the “law of diminishing marginal utility,” causing the curve to reverse course and slope upward.
- The total cost continues to accelerate as output expands, as the risks attributable to increased scale offset the rapidly diminishing returns.
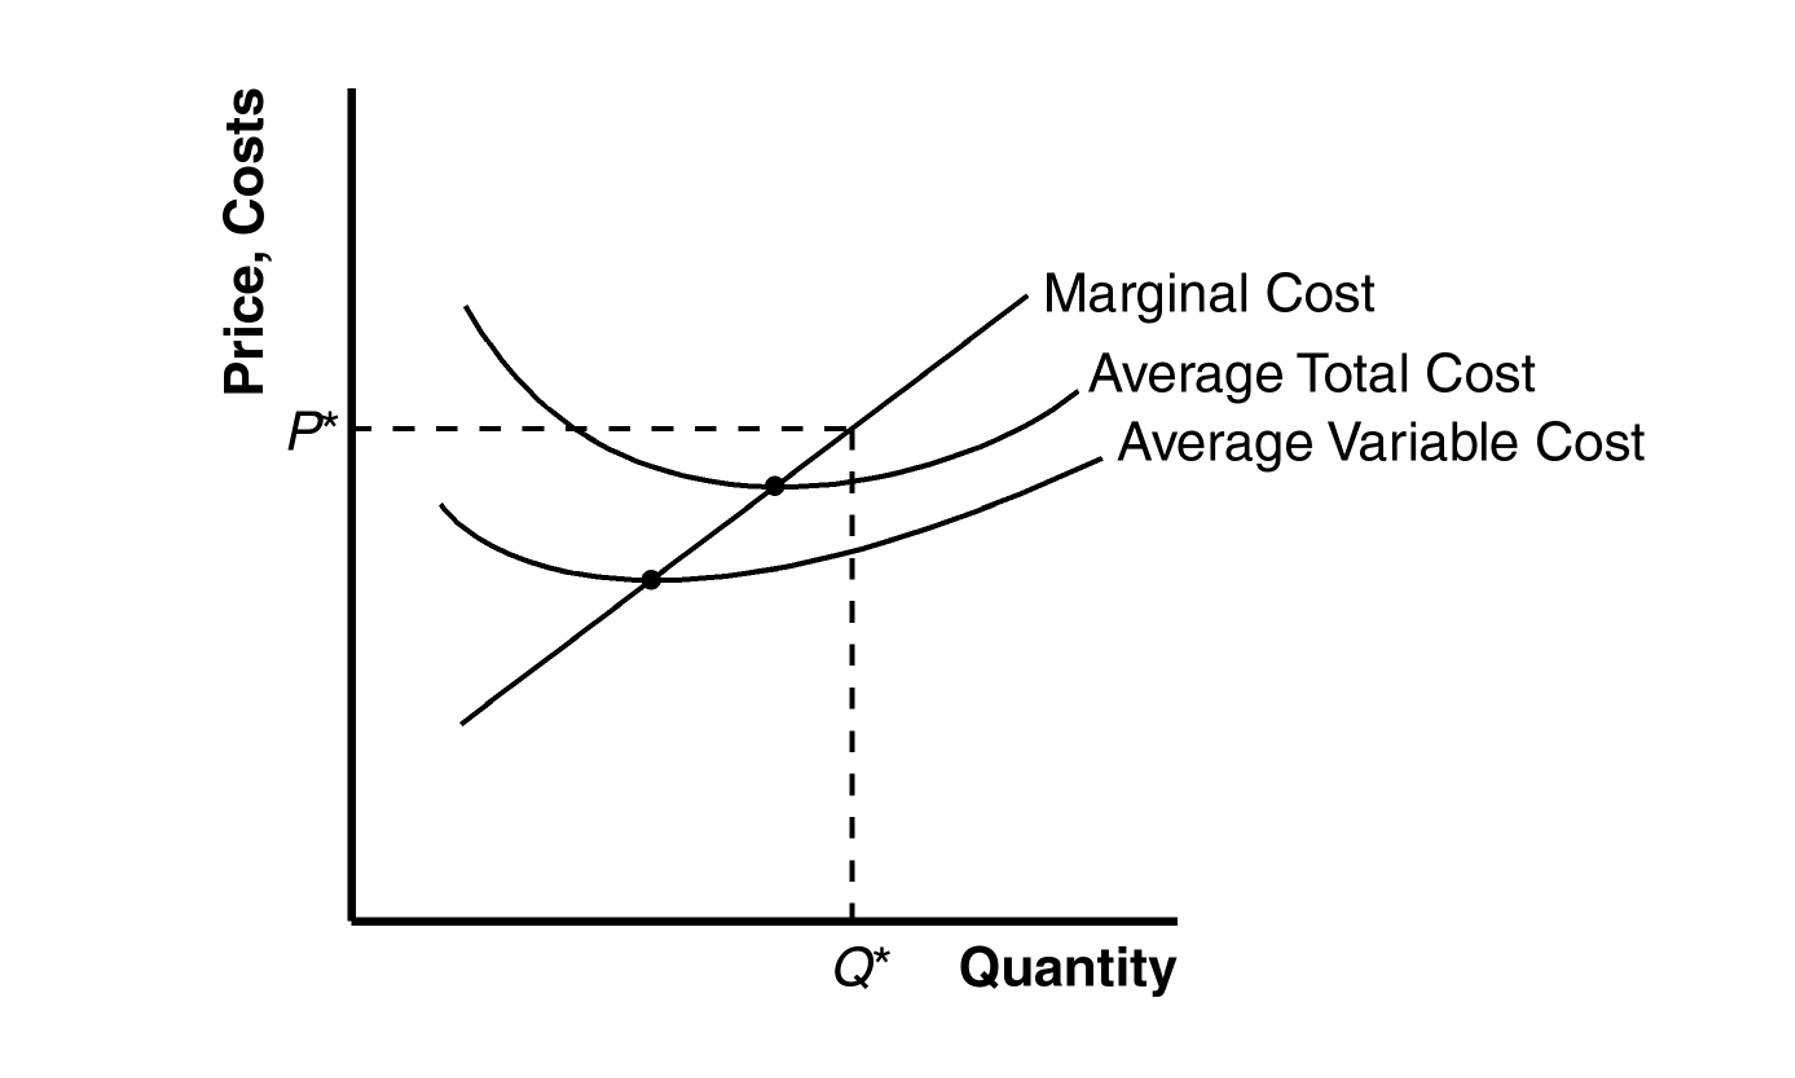
Average Total Cost Curve – Illustrative Graph
The spreading effect and the law of diminishing utility are the two factors that cause the U-shape curve to form in the graph.
Economics Cost Curve (Source: Minnesota State)
Average Total Cost vs. Marginal Cost: What is the Difference?
The difference between the average total cost (ATC) and marginal cost is as follows.
- Average Total Cost (ATC) → The average total cost curve reflects the average cost of production at different levels of output.
- Marginal Cost (MC) → In contrast, the marginal cost is calculated as the change in total cost divided by the change in quantity. The marginal cost curve illustrates the incremental cost of producing one more unit of output, i.e. it focuses on the next unit.
The average total cost curve decreases until reaching its inflection points – where it intersects with the marginal cost curve – before starting an upward trajectory.
The intersection between the marginal cost and average total cost curve matters, because the marginal cost of production was below the average total cost until the inflection point.
However, once the marginal cost of production crosses the average total cost curve – the minimum point of the ATC curve – the production of one more unit starts to exceed the average cost.
The downward-sloping curve then reverses course, as the marginal production of one unit causes the average cost to rise (and initiates the upward-sloping part of the curve).
Unlike the marginal cost, the average total cost is more comprehensive of the costs factored in, and is thus a more practical measure against which to set pricing.
Average Total Cost Calculator
We’ll now move to a modeling exercise, which you can access by filling out the form below.
1. Cost Structure Assumptions
Suppose we’re tasked with analyzing the cost structure of a high-growth B2C eCommerce startup given the following assumptions.
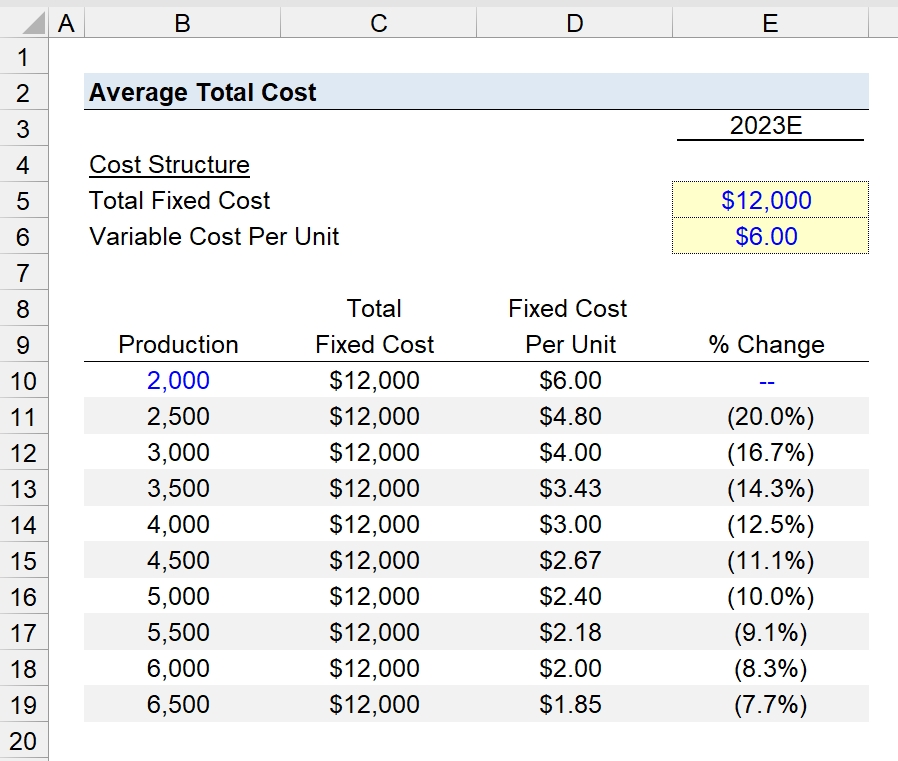
- Total Fixed Cost = $12k
- Variable Cost Per Unit = $6.00
Based on historical data, an overseas manufacturer produced the company’s products at steeply discounted prices, i.e. the company’s strategy is to acquire customers by offering cheap products (and to then use upselling and cross-selling tactics to generate more revenue).
However, the demand for the company’s products has increased in the prior period, causing management to consider placing large orders to ensure that consumer demand is met in 2023.
According to management, the range for production output is between 2k and 6.5k – reflecting the life cycle stage the startup is currently in (and the uncertainty).
The total fixed cost is $12k at all production levels, which we’ll divide by the units produced to determine the fixed cost per unit.
For instance, the fixed cost per unit at the production level of 2k is $6.00.
- Fixed Cost Per Unit = $12k ÷ 2,000 = $6.00
2. Average Total Cost Calculation Example
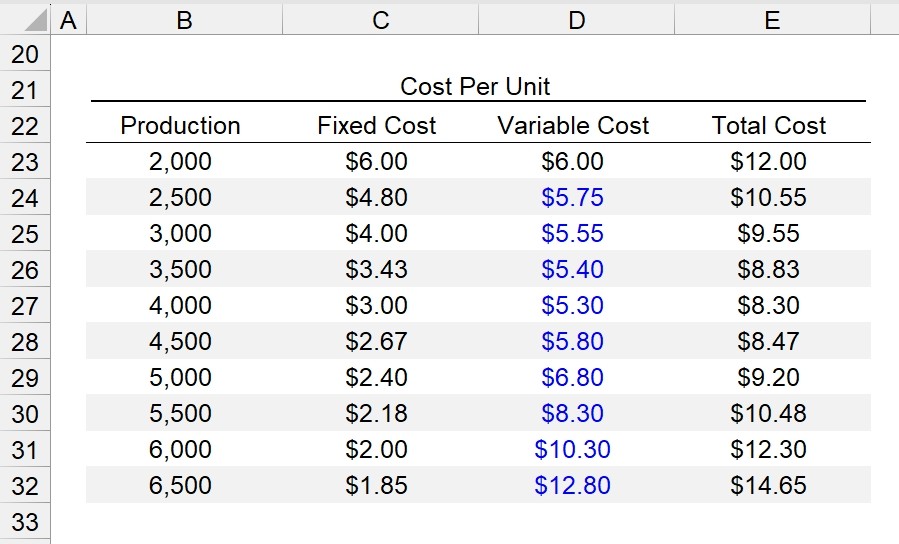
In the next part of our exercise, we’ll create a table in Excel that lists the production output, fixed cost per unit (or “average fixed cost”), and the variable cost per unit (or “average variable cost”).
For the average variable cost, we’ll start by linking to the initial assumption from earlier ($6.00).
From that point onward, we’ll assume the variable cost per unit will undergo the following changes.
Variable Cost Per Unit
- Production @ 2,500 → ($0.25)
- Production @ 3,000 → ($0.20)
- Production @ 3,500 → ($0.15)
- Production @ 4,000 → ($0.10)
- Production @ 4,500 → $0.50
- Production @ 5,000 → $1.00
- Production @ 5,500 → $2.50
- Production @ 6,000 → $1.50
- Production @ 6,500 → $2.00
Note: The assumptions are deliberately simplified (and hardcoded inputs) – the actual impact on variable costs depends on the company’s capacity and operating efficiency.
Therefore, we can see the average variable cost increases from $5.75 to $12.80 at production levels 2,500 and 6,500, respectively.
The “Total Cost” column adds the fixed cost per unit to the variable cost per unit.
Initially, the total average cost per unit started at $12.00, before reaching $14.65 at the upper parameter.
Total Cost Per Unit
- Production @ 2,000 → $12.00
- Production @ 2,500 → $10.55
- Production @ 3,000 → $9.55
- Production @ 3,500 → $8.83
- Production @ 4,000 → $8.30
- Production @ 4,500 → $8.47
- Production @ 5,000 → $9.20
- Production @ 5,500 → $10.48
- Production @ 6,000 → $12.30
- Production @ 6,500 → $14.65
The minimum point at which the average cost is at its lowest value is when production is 4,000, where the average cost is $8.30.
In conclusion, the B2C eCommerce startup should likely order between 3,500 and 4,500 production units to optimize its margin profile.
- Minimum Total Average Cost → Production = 4,000 ($8.30 per Unit)
By analyzing a company’s average total cost (ATC) – including the composition between fixed and variable costs in the cost structure – the management team can optimize the company’s operating efficiency and expand its profit margins.