 Skip to main content
What is Average Fixed Cost?
The Average Fixed Cost (AFC) is the fixed costs incurred by a company that remain constant irrespective of output, expressed on a per-unit basis.
How to Calculate Average Fixed Cost
The average fixed cost is an estimate of the costs incurred to manufacture one production unit.
The average fixed cost is a financial metric used to analyze the fixed cost component of the cost structure of a given company.
The average fixed cost is an estimate of the cost incurred to manufacture one production unit.
Broadly put, the costs incurred by companies can be designated as fixed or variable costs.
- Fixed Costs (FC) → Fixed costs, as implied by the name, remain relatively the same under different levels of output (i.e. production volume).
- Variable Costs (VC) → In contrast, variable costs fluctuate directly based on the level of output in a given period.
Unlike variable costs, fixed costs remain constant, regardless of the number of goods and services produced in a given period.
In a nutshell, the average fixed cost is the fixed cost per unit of a company, calculated by dividing its total fixed cost burden by the total unit output.
A company must strategically manage its cost structure to understand where its revenue is allocated and what directly impacts its profit margins.
Fixed costs are independent of factors such as revenue, production volume, market demand, etc.
The following list contains the most common types of fixed costs incurred by companies in their day-to-day operations.
- Rental or Lease Payments
- Employee Salaries (Base Salary, Excluding Bonuses)
- Property Taxes
- Utilities (Internet Wi-Fi, Gas, A/C, Water)
- Insurance Premiums
The step-by-step process to calculate the average fixed cost is as follows.
- Separate Total Costs (TC) into Fixed Costs or Variable Costs
- Calculate the Sum of Fixed Costs
- Divide the Total Fixed Costs by the Number of Units Produced (Output)
Semi-Variable Costs
The distinction between fixed and variable costs is a broad generalization.
For instance, there is validity to the counterpoint that electricity and water bills could be classified as variable costs, as increased usage causes the bill to rise.
Hence, certain practitioners designate costs that share traits of fixed and variable costs as “semi-variable costs”.
How to Analyze Fixed Cost Per Unit?
Performing cost structure analysis is mandatory to understand where the capital (and revenue) of a company is spent, including ensuring that there is sufficient “cushion” for underperformance.
Given the insights derived from the analysis, a company’s management team must then set pricing rates appropriately, establish budget constraints, and optimize its business model to improve the operating efficiency of the company.
The proportion of fixed costs in a company’s cost structure varies widely based on industry and business model.
- Capital Intensive Business Model → The fixed costs incurred by a manufacturer that builds heavy machinery for their customer base will be outsized compared to a service-based company, such as a consulting firm.
- Labor Intensive Business Model → The cost of labor is the most significant expense for consulting firms, as the number of clients who hire the firm for their consulting services (i.e. output) is their source of revenue. But if client demand underwent a steep decline due to unforeseeable circumstances, the firm’s total costs would decline in proportion, since the consultants are no longer working in that case.
With that said, the average fixed cost per unit is only informative if the comparisons are between that of similar companies (i.e. industry peers, competitors).
Average Fixed Cost Formula
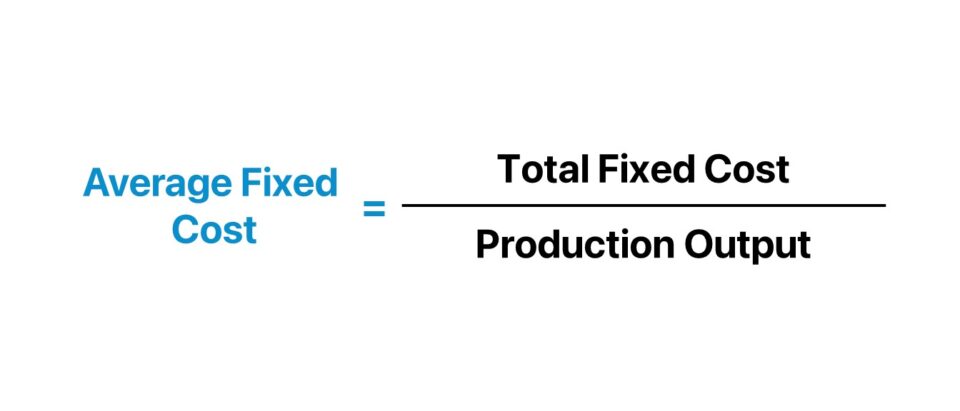
The formula to calculate the average fixed cost is as follows.
Where:
- Total Fixed Cost → The sum of all fixed costs incurred by the company over a set period.
- Production Output → The total quantity or volume of units produced in the coinciding period (i.e. “output”)
For example, suppose an industrials manufacturer produced 50 product units in 2023 while incurring $10k in fixed costs.
The average fixed cost per unit is approximately $200.00.
- Average Fixed Cost (AFC) = 10,000.00 ÷ $50.00 = $200.00
With that said, the manufacturer must quantify its average variable cost per unit to use in conjunction with the average fixed cost per unit to determine its break-even point (BEP) in order to determine the necessary pricing to ensure a profit is generated.
The Wharton Online & Wall Street Prep Applied Value Investing Certificate Program
Learn how institutional investors identify high-potential undervalued stocks. Enrollment is open for the upcoming cohort.
Enroll TodayHow Does Economies of Scale Impact Average Fixed Cost?
The concept of economies of scale states that increased output in production contributes to a decline in the average cost per unit.
- Increase in Production Output → Decline in Average Cost Per Unit
- Decrease in Production Output → Increase in Average Cost Per Unit
So, why does the average cost per unit decline from an increase in production output?
In short, the average cost per unit decreases as output increases, because fixed costs can be “spread” across a higher quantity of production units.
Therefore, an increase in production volume causes the fixed cost per unit to decrease.
However, the positive impact on a company’s margin profile from increased scale declines with greater size due to the marginal benefit of utility.
On that note, a corporation’s initiatives to improve growth and scale must be strategically planned – i.e. expansion in scale without a plan will inevitably impede operating efficiency (and compress profit margins).
Economies of Scale vs. Diseconomies of Scale
Economies of scale can initially cause a company’s margins to expand.
But once the company has reached a certain size, the continuation of expansion into new end markets and geographies can start to present more risks, which must not be neglected.
In particular, the average cost per unit of production can eventually start to rise as output increases, which is termed “diseconomies of scale”, wherein the risks of increased scale outweigh the benefits.
Average Fixed Cost Calculator
We’ll now move to a modeling exercise, which you can access by filling out the form below.
1. Average Fixed Cost Calculation Example
Suppose we’re tasked with analyzing the average fixed cost of a premium, niche food manufacturer in 2023.
The total fixed costs of the manufacturer is estimated to be $10k, while the variable cost per unit is $20.
- Total Fixed Cost = $10,000
- Variable Cost Per Unit = $20.00
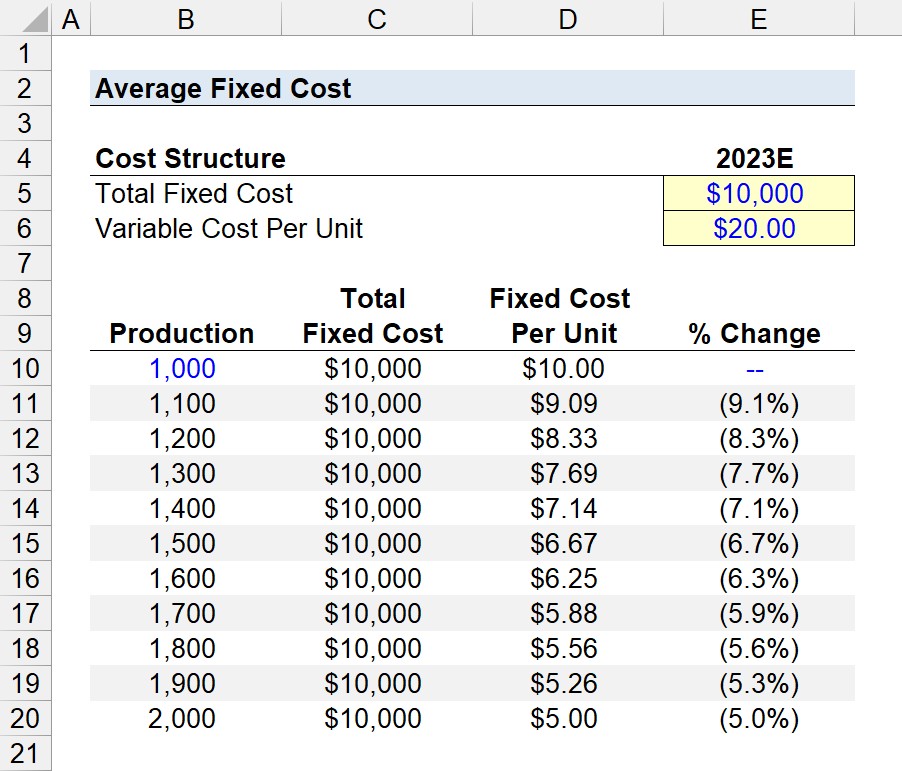
The manufacturer expects to produce between 1,000 and 2,000 units, which we’ll input into our spreadsheet to measure the incremental benefit on the per-unit costs from increased output.
In the first step, the total fixed cost of $10k is linked to the assumption cell formatted in blue font color and anchored by pressing F4 once before being copied across the entire column in the table.
In the column to the right – “Fixed Cost Per Unit” – we must divide the total fixed cost by the coinciding production units, which increases by 100 in each row.
Initially, the fixed cost per unit is $10.00 at a production level of 1,000. However, due to the effects of economies of scale, the fixed cost per unit declines to $5.00 at a production level of 2,000.
- Average Fixed Cost (Production = 1,000) = $10,000 ÷ 1,000 = $10.00
- Average Fixed Cost (Production = 2,000) = $10,000 ÷ 2,000 = $5.00
For the sake of measuring the percent change per increase in the production level, we’ll insert a column on the right to calculate the change, expressed as a percentage.
2. Total Cost Per Unit Analysis Example
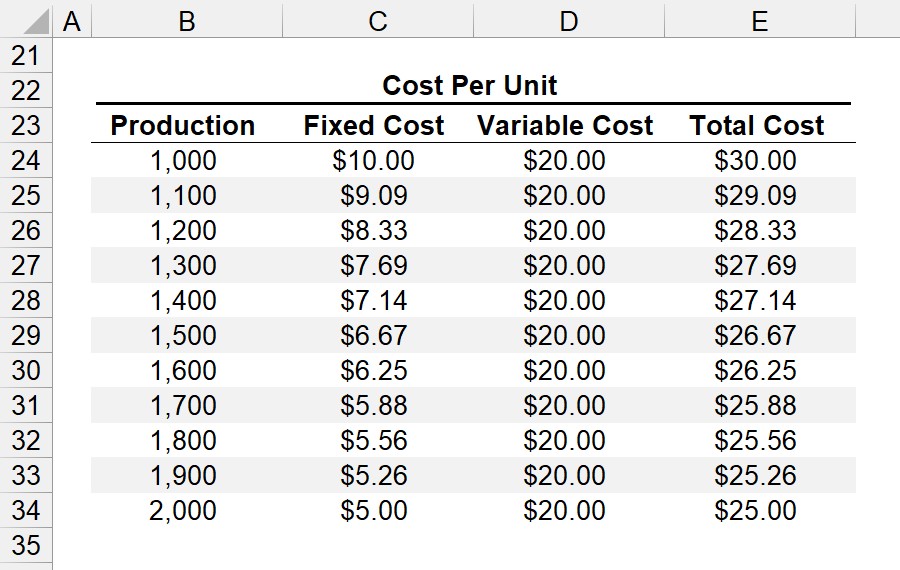
In the next part of our exercise, we’ll compute the total cost per unit using the figures determined in the prior step, and our variable cost per unit assumption as stated earlier.
Starting off, the initial step to complete our “Cost Per Unit” table is to link to the production and fixed cost (i.e. the “Fixed Cost Per Unit”, rather than “Total Fixed Cost”).
The “Variable Cost” is linked to our earlier assumption input (and anchored). The fact that the variable cost is constant might seem counterintuitive but remember that the table measures the cost on a per-unit basis.
Once the three columns are complete, the total cost per unit can be calculated by adding the fixed cost per unit to the variable cost per unit.
In conclusion, the manufacturer’s total cost per unit of $25.00 at a production level of 2,000 is $5.00 less than the $30.00 cost per unit as calculated at a production level of 1,000.
Since the fixed costs of a company remain constant regardless of the production output, increasing the number of units produced causes the average fixed cost per unit (and the total cost per unit) to decline.
The Wharton Online & Wall Street Prep Applied Value Investing Certificate Program
Learn how institutional investors identify high-potential undervalued stocks. Enrollment is open for the upcoming cohort.
Enroll Today


