 Skip to main content
What is a Levered DCF Model?
The Levered DCF Model values a company by discounting the forecasted cash flows that belong only to equity holders, excluding all cash flows to non-equity claims such as debt.
How to Build a Levered DCF Model?
A discounted cash flow model (DCF) estimates the intrinsic value of a company by forecasting its free cash flows (FCFs) and discounting them to the present date.
The standard DCF structure is a two-stage model, which consists of an explicit forecast period of 5 to 10 years and a terminal value assumption to arrive at the implied valuation.
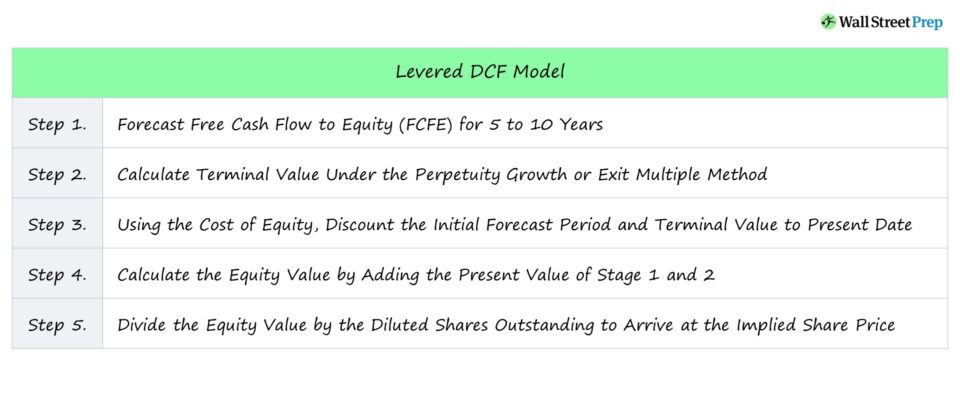
The process of building a levered DCF model can be broken into the following five steps:
- Forecast Free Cash Flow to Equity (FCFE): The company’s levered free cash flows – the remaining cash flows that belong only to equity holders – are projected for five to ten years.
- Calculate Terminal Value: The value of all levered FCFs past the initial Stage 1 forecast period must be estimated, i.e. the terminal value, using either the perpetuity growth method or exit multiple approach.
- Discount Stage 1 and Stage 2: Since the DCF represents the value of the company as of the current date, both Stage 1 and Stage 2 must be discounted using the cost of equity (ke) as the discount rate.
- Equity Value Calculation: The sum of the discounted periods calculates the equity value directly, i.e. all non-equity claims such as debt and minority interest are not included within the equity value.
- DCF-Derived Share Price: In the final step, the equity value is divided by the total diluted shares outstanding as of the valuation date to arrive at the DCF-derived value per share, which is then compared to the current market price per share.
How to Project FCFE in a Levered DCF Model?
For the levered DCF, the relevant projected cash flow is the free cash flow to equity (FCFE), which represents the residual cash flows left over after payments to non-equity stakeholders, namely debt providers, are deducted.
Free Cash Flow to Equity (FCFE) Formula
- FCFE = Net Income + D&A – Change in NWC – Capital Expenditure + Mandatory Debt Repayment
After interest expense and the mandatory debt repayment are subtracted from FCFE, these remaining cash flows belong solely to equity owners.
Moreover, FCFE is indicative of the cash flows that can be distributed to shareholders as dividends, used to repurchase shares (i.e. share buybacks), or kept as retained earnings to be reinvested into sustaining current and future growth.
Calculating the FCFE begins with net income, which is adjusted for non-cash items and changes in working capital, resulting in cash flow from operating activities (CFO).
From CFO, capital expenditures (capex) – the primary line item in the cash flow from investing activities (CFI) section – is subtracted because it is a recurring, core expenditure of the company.
Finally, the cash inflows from new debt borrowings are added, net of any cash outflows related to the repayment of debt.
Unlevered vs. Levered DCF Valuation: What is the Difference?
In theory, the levered and unlevered DCF should result in the same valuation – but in practice, it is uncommon for the two values to be precisely equivalent.
- Levered DCF: The levered DCF approach calculates the equity value directly, unlike the unlevered DCF, which arrives at the enterprise value (and requires adjustments thereafter to arrive at equity value).
- Unlevered DCF: The unlevered DCF discounts the unlevered FCFs to arrive at the enterprise value (TEV). From the enterprise value, net debt and any non-equity claims are subtracted to calculate the equity value.
Another notable difference between the levered and unlevered DCF – other than the type of free cash flow (FCF) projected – is the discount rate.
The discount rate represents the minimum required rate of return on an investment given its specific risk profile, i.e. higher risk → higher expected return (and vice versa).
- Levered DCF: The correct discount rate on FCFE is the cost of equity because these cash flows belong to equity owners only and should thereby reflect the expected return (and risk) of solely equity capital.
- Unlevered DCF: In contrast, the weighted average cost of capital (WACC) is used for the unlevered DCF since it reflects the required rate of return (and risk) to all capital providers, not just equity holders. The appropriate discount rate for an unlevered DCF is the WACC since the rate must reflect the risk to all capital providers, including both debt and equity capital providers.
In a levered DCF, to calculate equity value from the enterprise value, you would then add back net debt (and for the reverse scenario, net debt would be subtracted to calculate enterprise value from equity value).
Levered DCF Model – Excel Template
We’ll now move to a modeling exercise, which you can access by filling out the form below.
1. Levered DCF Model Example Calculation
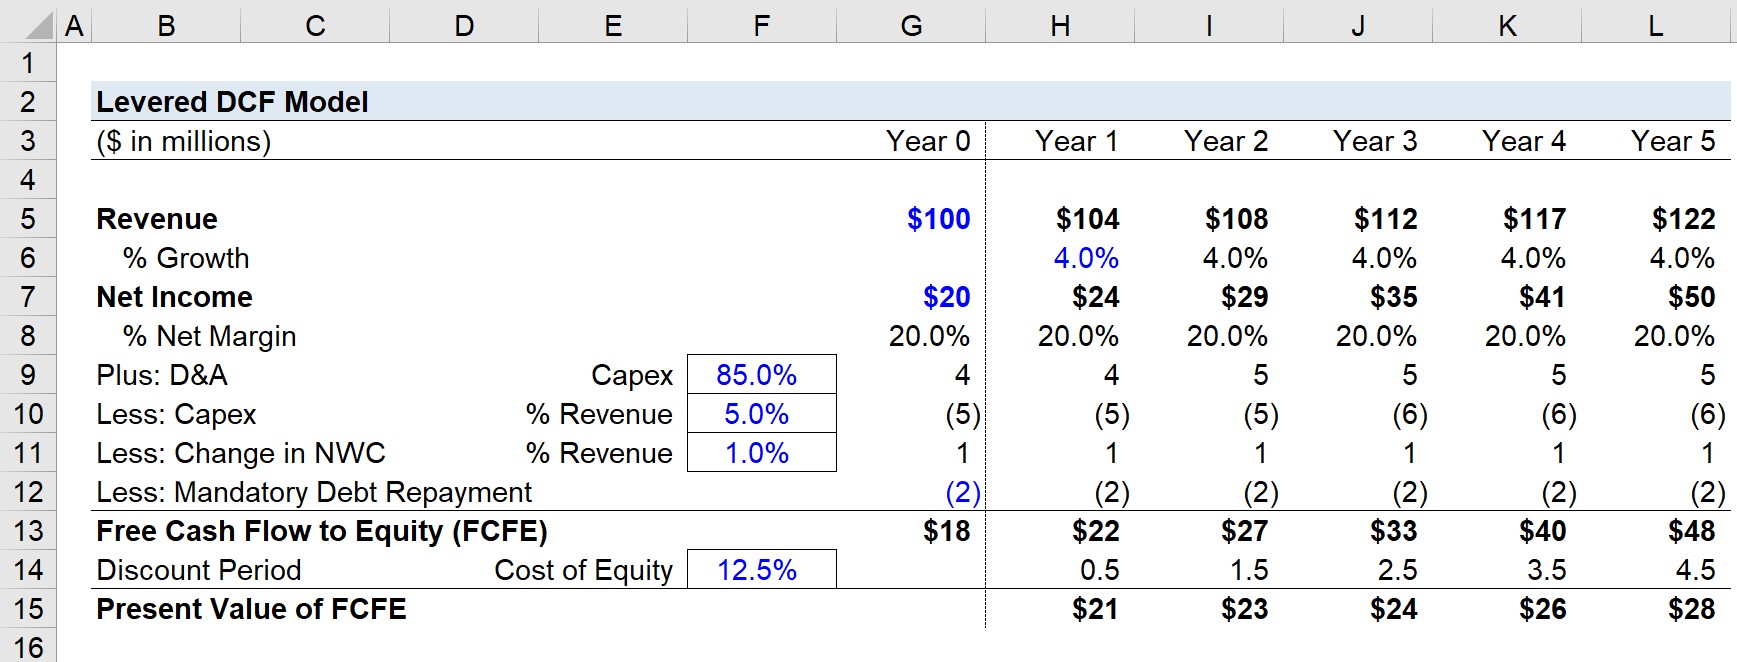
Suppose we’re using a levered DCF model to value a company that generated $100 million in revenue during the trailing twelve months (TTM).
In the same time span, the company’s net income was $20 million, so its net margin was 20%.
For the entire forecast period – from Year 1 to Year 5 – the revenue growth rate will be assumed to be 4.0% each year, whereas the net margin assumption will be kept constant at 20.0%.
- Revenue Growth Rate = 4%
- Net Margin = 20%
The other model assumptions that affect our free cash flow to equity (FCFE) calculation are the following:
- D&A = 85% of Capex
- Capex = 5% of Revenue
- Change in NWC = 1% of Revenue
- Mandatory Debt Repayment = $2 million / Year
The FCFE is equal to net income adjusted for D&A, capex, change in NWC, and mandatory debt repayment.
In the next step, each projected FCFE is discounted to the present date using the cost of equity, which we’ll assume to be 12.5%.
- Cost of Equity = 12.5%
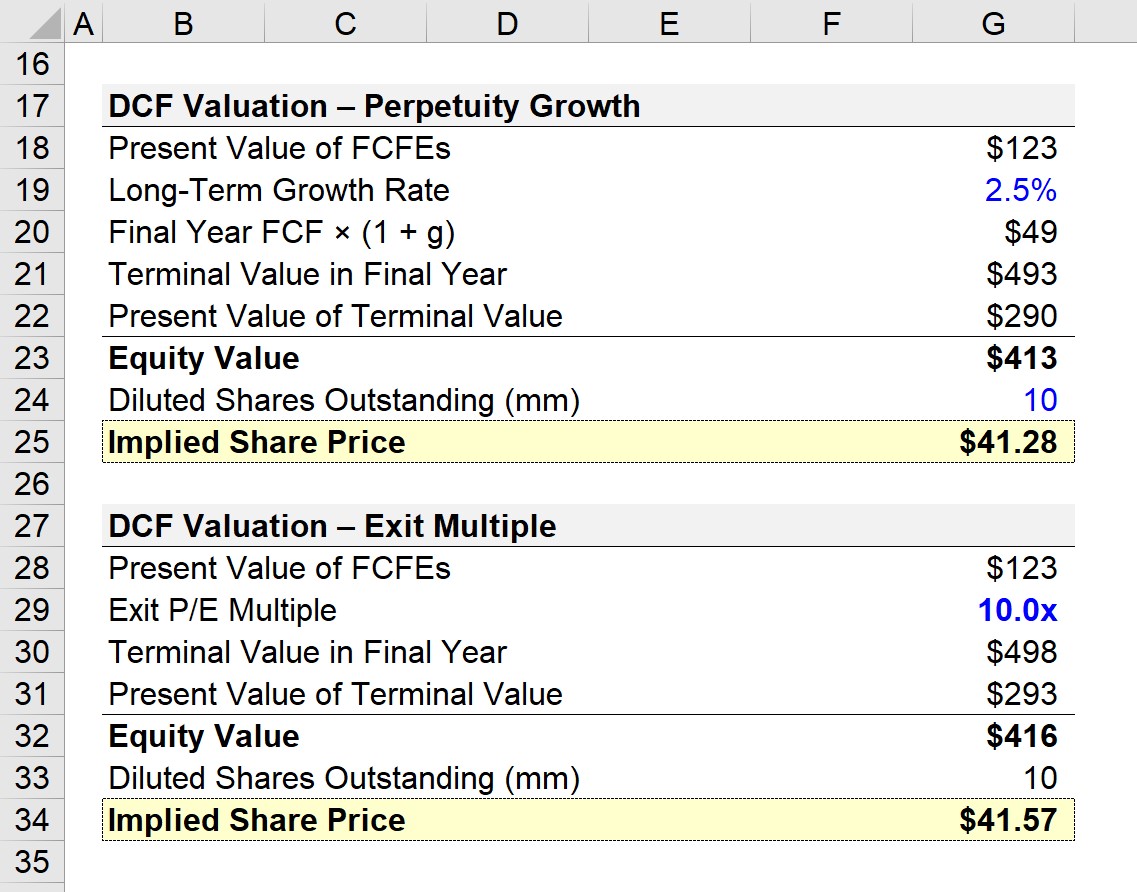
2. Levered DCF Terminal Value Calculation Example
The sum of the Stage 1 present value of the FCFE projection is $123 million.
We’ll now calculate the terminal value, where we have two options:
- Perpetuity Growth Method
- Exit Multiple Method
For the perpetuity growth method, we’ll assume the company’s long-term growth rate is 2.5%.
Next, the final year FCFE is grown by 2.5%, which comes out to $49 million.
- Long-Term Growth Rate = 2.5%
- Final Year FCF * (1 + g) = $49 million
To calculate the terminal value in the final year, we’ll divide $49 million by our 12.5% cost of equity minus the 2.5% growth rate.
- Terminal Value in Final Year = $49 million / (10% – 2.5%) = $493 million
The DCF is based on the current date on which the valuation is performed, meaning the terminal value must also be discounted to the present date.
The present value of the terminal value is $290 million, which was calculated by dividing the terminal value in the final year by (1 + ke) ^ Discount Factor.
- Present Value of Terminal Value = $493 million / (1 + 12.5%) ^ 4.5
- PV of Terminal Value = $290 million
The equity value is the sum of Stage 1 and Stage 2, i.e. $413 million.
If we assume the number of diluted shares outstanding is 10 million, the implied share price is $41.28.
- Implied Share Price = $413 million / 10 million = $41.28
As for the exit multiple method, we’ll assume the exit P/E multiple is 10.0x.
The reason we use the P/E multiple rather than the EV/EBITDA multiple is to ensure consistency is maintained in the capital providers represented (in this case, only equityholders).
In other words, the P/E multiple is a post-debt levered metric, just like the FCFE and cost of equity.
The terminal year in the final year is equal to the exit P/E multiple times the final year net income.
- Terminal Value in Final Year = $49 million * 10.0x = $498 million
Like the perpetuity growth method, we’ll discount the terminal value to the present date using the same formula.
- Present Value of Terminal Value = $293 million
By dividing the equity value by the diluted share count, the implied share price under the exit multiple method is $41.57.

Everything You Need To Master Financial Modeling
Enroll in The Premium Package: Learn Financial Statement Modeling, DCF, M&A, LBO and Comps. The same training program used at top investment banks.
Enroll Today


What about if the Company project some equity issuance in order to grow their sales for example. How we should consider this “inflow” in the FCFE
Hi, Ignacio,
Great question. If the company receives a cash inflow from equity holders that is invested in the business, then that will negatively impact FCFE in the same way that capex is a negative cash flow in the period when it happens.
BB
Why do you use 0.5 as period increments not 1?
Hi, Luke, We are using a midyear adjustment to the discount period to treat the cash flows as if they happen in the middle of the year rather than at the end of the year (which more closely approximates the value of cash flows that happen throughout the year). We… Read more »
Regarding the Discount Period, why are you using -0.5 for this rather than full years?
Hi, Maarten, We are using a midyear adjustment to the discount period to treat the cash flows as if they happen in the middle of the year rather than at the end of the year (which more closely approximates the value of cash flows that happen throughout the year). We… Read more »
Everything else being equal, is there a big difference between the EqV obtained through the DCF FCFF method and the EqV obtained through DCF FCFE method ?
Hi, Paul, In theory, they should be the same result if everything is consistent between the two methods in terms of assumptions. But it would probably require a very strictly maintained capital structure mix (which impacts WACC and CoE) and a projection of debt borrowing and paydown in the FCFE… Read more »