 Skip to main content
What is Operating Cycle?
The Operating Cycle tracks the number of days between the initial date of inventory purchase and the receipt of cash payment from customer credit purchases.
How to Calculate Operating Cycle?
Conceptually, the operating cycle measures the time it takes a company to purchase inventory, sell the finished inventory, and collect cash from customers who paid on credit.
- Start of Cycle → The “start” of the cycle refers to the date when the company purchased the inventory (i.e. raw material) to turn it into a marketable product available for sale.
- End of Cycle → The “end” is when cash payment for the product purchase is received from customers, who often pay on credit, not cash (i.e. accounts receivable).
The required inputs for the metric consist of two working capital metrics:
- Days Inventory Outstanding (DIO) → DIO measures the number of days it takes on average before a company must replenish its inventory on hand.
- Days Sales Outstanding (DSO) → DSO measures the number of days it takes on average for a company to collect cash payments from customers that paid using credit.
Operating Cycle Formula
Below are the formulas for calculating the two working capital metrics:
The formula for calculating the operating cycle is the sum of days inventory outstanding (DIO) and days sales outstanding (DSO).
The operating cycle is relatively straightforward to calculate, but more insights can be derived from examining the drivers behind DIO and DSO.
For instance, the duration of a particular company could be high relative to comparable peers. Such an issue could stem from the inefficient collection of credit purchases, rather than due to supply chain or inventory turnover issues.
Once the real underlying issue has been identified, management can better address and fix the problem.
How to Interpret the Operating Cycle?
The longer the operating cycle, the more cash is tied up in operations (i.e. working capital needs), which directly lowers a company’s free cash flow (FCF).
- Lower Operating Cycle → The company’s operations are more efficient – all else being equal.
- Higher Operating Cycle → On the other hand, higher operating cycles point towards weaknesses in the business model that must be addressed.
Operating Cycle vs. Cash Conversion Cycle: What is the Difference?
The cash conversion cycle (CCC) measures the number of days for a company to clear out its inventory in storage, collect outstanding A/R in cash, and delay payments (i.e. accounts payable) owed to suppliers for goods/services already received.
At the start of the calculation, the sum of DIO and DSO represents the operating cycle – and the added step is subtracting DPO.
Hence, the cash conversion cycle is used interchangeably with the term “net operating cycle”.
Operating Cycle Calculator
We’ll now move to a modeling exercise, which you can access by filling out the form below.
Operating Cycle Calculation Example
Suppose we’re tasked with assessing the working capital efficiency of a company with the following assumptions:
Year 1 Financials
- Revenue: $100 million
- Cost of Goods (COGS): $60 million
- Inventory: $20 million
- Accounts Receivable (A/R): $15 million
Year 2 Financials
- Revenue: $120 million
- Cost of Goods (COGS): $85 million
- Inventory: $25 million
- Accounts Receivable (A/R): $20 million
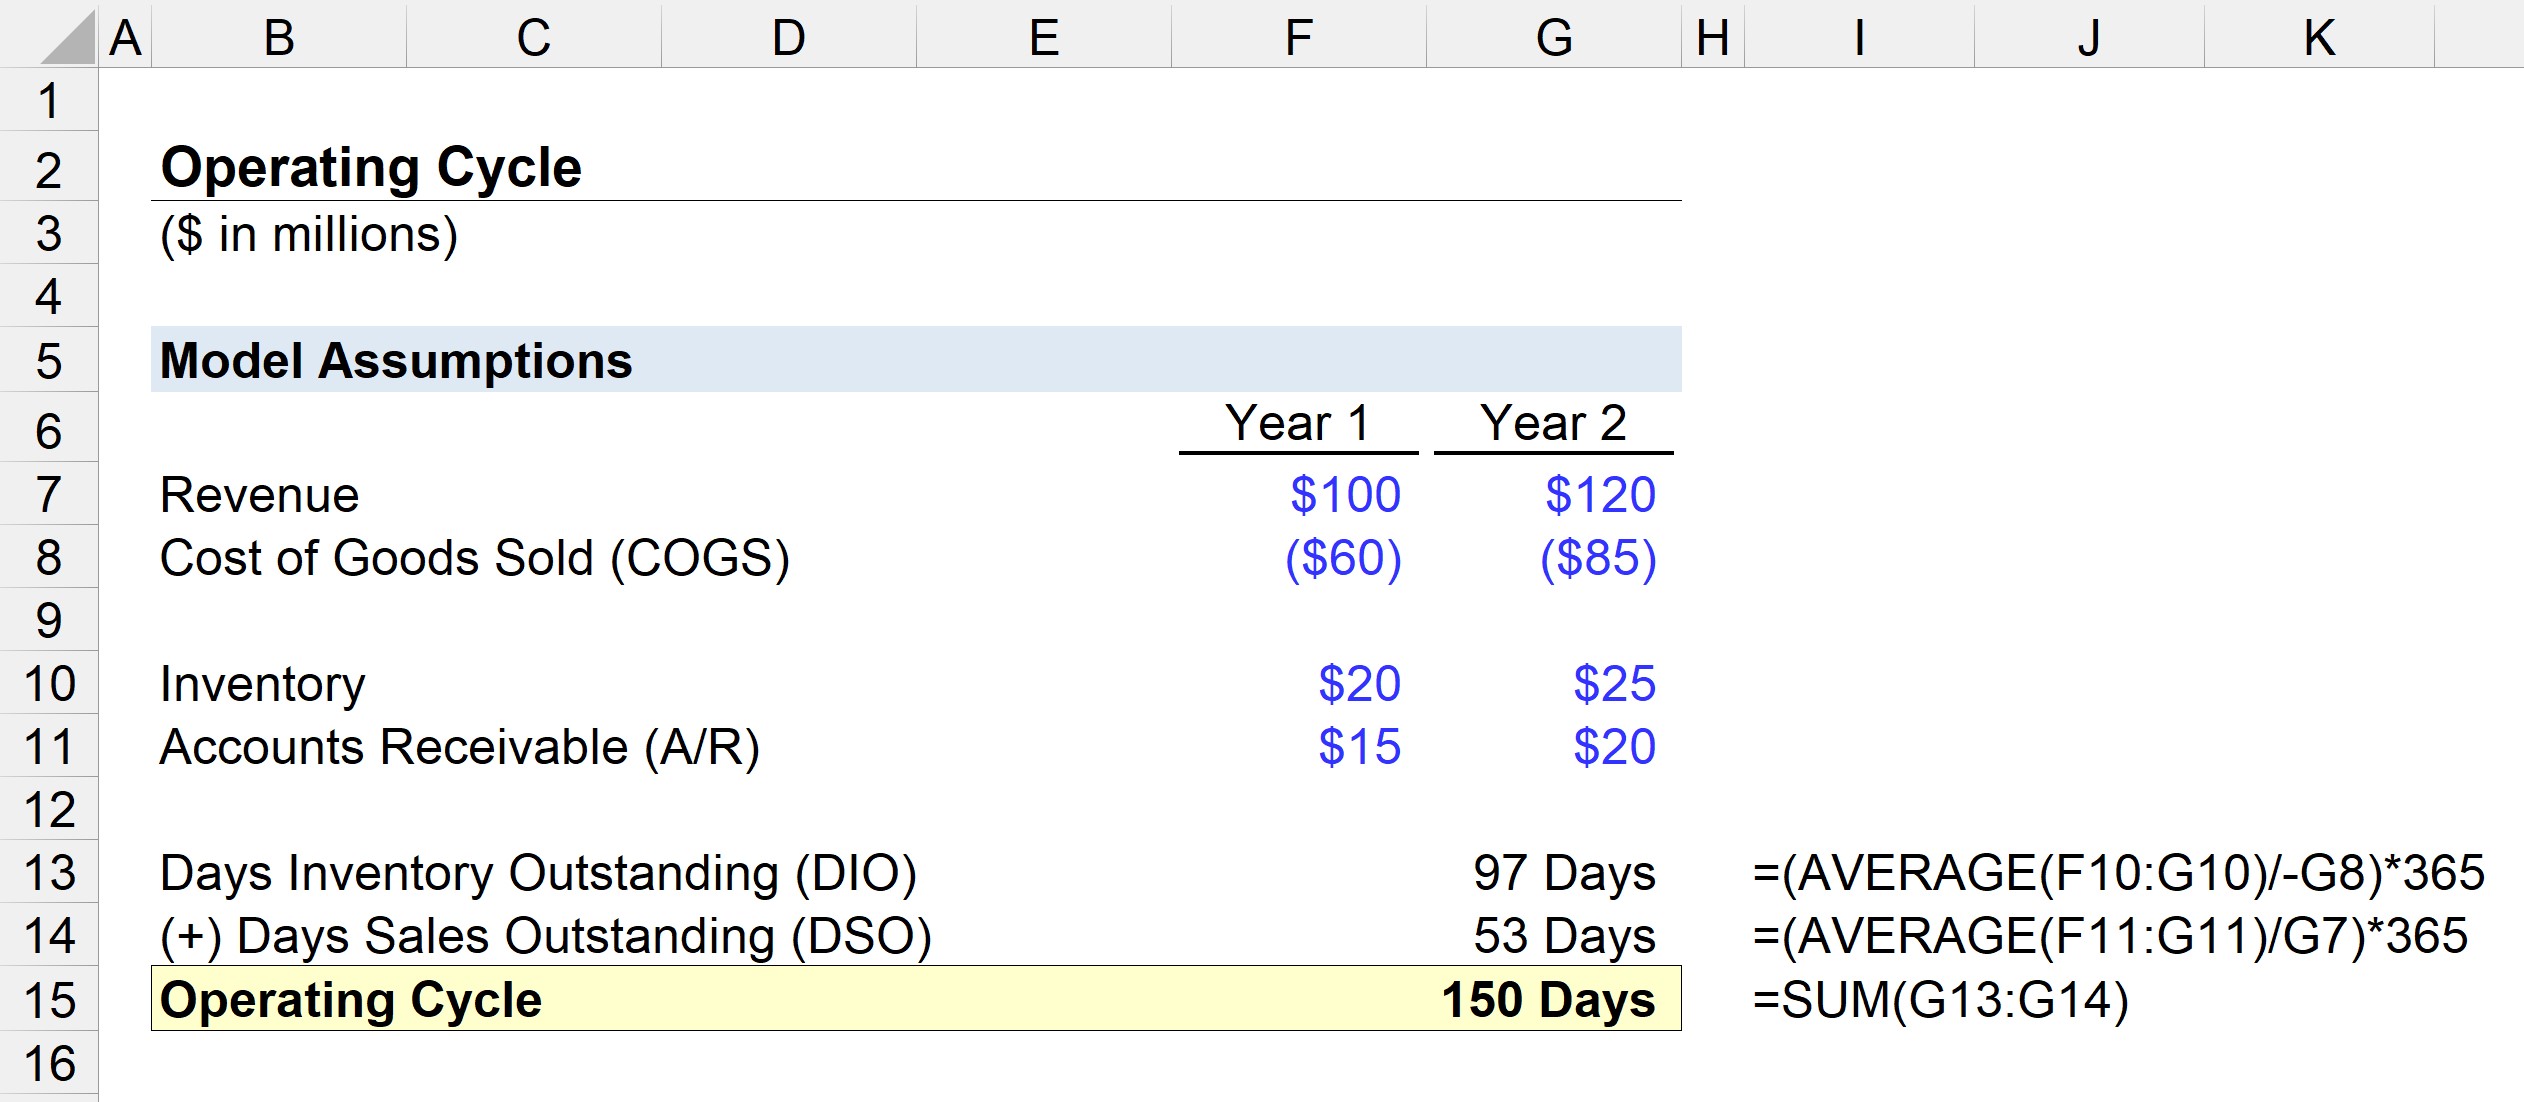
The first step is to calculate DIO by dividing the average inventory balance by the current period COGS and then multiplying it by 365.
- DIO = AVERAGE ($20m, $25m) / $85 * 365 Days
- DIO = 97 Days
On average, it takes the company 97 days to purchase raw material, turn the inventory into marketable products, and sell it to customers.
In the next step, we will calculate DSO by dividing the average A/R balance by the current period revenue and multiplying it by 365.
- DSO = AVERAGE ($15m, $20m) / $120m * 365 Days
- DSO = 53 Days
The operating cycle is equal to the sum of DIO and DSO, which comes out to 150 days in our modeling exercise.
- Operating Cycle = 97 Days + 53 Days = 150 Days

Everything You Need To Master Financial Modeling
Enroll in The Premium Package: Learn Financial Statement Modeling, DCF, M&A, LBO and Comps. The same training program used at top investment banks.
Enroll Today


What if I have a service company that doesn’t has inventory in their statements?
Hi, Jordan,
If that is the case, then the operating cycle would be from when cash was outlaid to pay whatever expenses were needed to get the next service up and running to when the cash was ultimately collected for that service.
BB