
What is Accounts Receivable Turnover?
The Accounts Receivable Turnover is a working capital ratio used to estimate the number of times per year a company collects cash payments owed from customers who had paid using credit.

How to Calculate Accounts Receivable Turnover
The accounts receivable turnover ratio, or “receivables turnover”, measures the efficiency at which a company can collect its outstanding receivables from customers.
On the balance sheet, accounts receivable (A/R) represents the unmet payment obligations by customers, so the quick retrieval of owed cash payments implies the company can efficiently manage the credit extended to customers.
Tracking the receivables turnover is crucial for companies, because an increase in accounts receivable means more free cash flows (FCFs) are tied up in operations.
In effect, the amount of real cash on hand is reduced, meaning there is less cash available to the company for reinvesting into operations and spending on future growth.
Accounts Receivable Turnover Formula
The formula for calculating the accounts receivable turnover ratio divides the net credit sales by the average accounts receivable for the corresponding periods.
Net credit sales are calculated as the total credit sales adjusted for any returns or allowances.
- Sales Returns – When customers send previously purchased products back to the seller due to the product/merchandise being defective, damaged, or unsatisfactory.
- Sales Allowances – The price charged by a seller was reduced, typically caused by mistakes related to calculating the order (e.g. accidental mispricing).
The average accounts receivable is equal to the beginning and end of period A/R divided by two.
“Bad Debt” and Accounts Receivable
The portion of A/R determined to no longer be collectible – i.e. “bad debt” – is left unfulfilled and is a monetary loss incurred by the company.
What is a Good Receivables Turnover Ratio?
Generally, the higher the accounts receivable turnover ratio, the more efficient a company is at collecting cash payments for purchases made on credit.
- Higher Receivables Turnover Ratio → The fewer payments owed to a company by customers, the higher the A/R turnover
- Lower Receivables Turnover Ratio → The more customer cash payments awaiting receipt, the lower the A/R turnover
Companies with efficient collection processes possess higher accounts receivable turnover ratios.
The accounts receivables turnover metric is most practical when compared to a company’s nearest competitors in order to determine if the company is on par with the industry average or not.
If the accounts receivable turnover is low, then the company’s collection processes likely need adjustments in order to fix delayed payment issues.
Low A/R turnover stems from inefficient collection methods, such as lenient credit policies and the absence of strict reviews of the creditworthiness of customers.
Accounts Receivable Turnover Calculator
We’ll now move to a modeling exercise, which you can access by filling out the form below.
1. Operating Assumptions
For our illustrative example, let’s say that you own a company with the following financials.
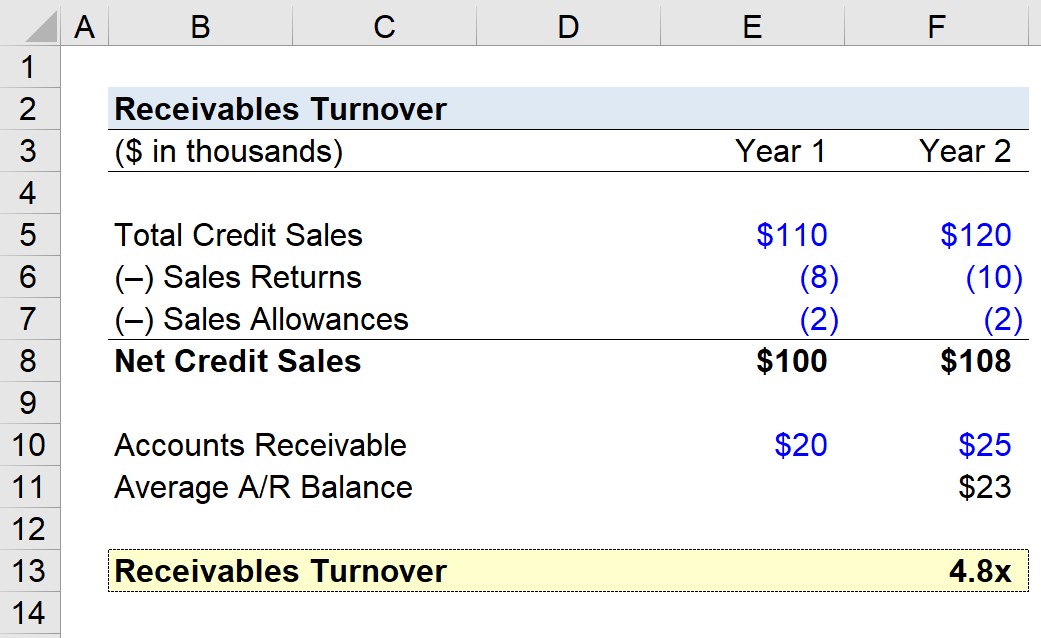
Financial Data (Year 1)
- Total Credit Sales = $110,000
- Sales Returns = $8,000
- Sales Allowances = $2,000
- Accounts Receivable = $20,000
Financial Data (Year 2)
- Total Credit Sales = $120,000
- Sales Returns = $10,000
- Sales Allowances = $2,000
- Accounts Receivable = $25,000
Since sales returns and sales allowances are outflows of cash, both are subtracted from total credit sales.
The net credit sales come out to $100,000 and $108,000 in Year 1 and Year 2, respectively.
- Year 1 Net Credit Sales = $110,000 – $8,000 – $2,000 = $100,000
- Year 2 Net Credit Sales = $120,000 – $10,000 – $2,000 = $108,000
The next step is to calculate the average accounts receivable, which is $22,500.
- Average Accounts Receivable = ($20,000 + $25,000) ÷ 2 = $22,500
2. Receivables Turnover Ratio Calculation Example
Now for the final step, the net credit sales can be divided by the average accounts receivable to determine your company’s accounts receivable turnover.
- Receivables Turnover Ratio = $108,000 ÷ $22,500 = 4.8x
Given the accounts receivable turnover ratio of 4.8x, the takeaway is that your company is collecting its receivables approximately five times per year.

Everything You Need To Master Financial Modeling
Enroll in The Premium Package: Learn Financial Statement Modeling, DCF, M&A, LBO and Comps. The same training program used at top investment banks.
Enroll Today


