 Skip to main content
What is Cash Turnover Ratio?
The Cash Turnover Ratio is an efficiency ratio that compares the net revenue and average cash and cash equivalents balance of a company. Conceptually, the cash turnover reflects the frequency at which a company replenishes its cash and cash equivalents using its net revenue.

How to Calculate Cash Turnover Ratio
The cash turnover measures the number of times a company can replenish its cash and cash equivalents balance using its net revenue over a specified period.
In practice, the cash turnover ratio is often used to gauge a company’s working capital efficiency (and thus, profitability margins).
The cash turnover metric is comprised of two inputs:
- Net Revenue → The net revenue metric is a company’s gross revenue following deductions for any customer returns, discounts, and sales allowances.
- Average Cash Balance → The average cash balance is the average between the current period cash balance and the prior period cash balance, which can both be found on the balance sheet.
Because the income statement covers financial performance over a period of time, while the balance sheet is a “snapshot” of a company’s assets, liabilities, and equity on a specific date, the average cash balance is used to ensure the numerator and denominator match.
The average cash balance equals the sum of the cash balance in the current period and the cash balance in the prior period, divided by two.
Using the ending cash balance, however, is still acceptable in most cases, barring unusual circumstances, i.e. if the company’s cash balance fluctuates significantly year over year (YoY).
Cash Turnover Formula
The formula for calculating the cash turnover ratio is equal to the net revenue of a company, divided by its average cash balance.
The cash turnover metric is usually calculated on an annual basis, i.e. for a full twelve-month fiscal year.
Additionally, separating cash from cash equivalents is unnecessary, as short-term investments like marketable securities and commercial paper are highly liquid (and can be converted into cash quickly and without losing much value).
How to Interpret the Cash Turnover Ratio
The cash turnover ratio measures the number of times across a specified period that a company’s cash balance has been spent.
Generally speaking, the higher the cash turnover, the more efficiently a company can convert its cash into revenue.
The reasoning is that a higher turnover implies that the company’s working capital management (i.e. cash conversion cycle) is shorter, so its cash cycles are quicker.
It is important to note, however, that a higher ratio is not necessarily better, as it could also mean that the company is using its cash more rapidly (i.e. a higher burn rate).
If that is the case, the company’s cash reserve may soon be depleted, and management might need to seek short-term financing to continue operating.
One major flaw to the cash turnover metric is that a company’s credit policy must be taken into account, or else misinterpretations can arise.
The metric is most applicable for companies where the majority of revenue stems from cash sales rather than credit sales.
Companies with revenue models where most purchases are made on credit will show a higher ratio relative to cash-oriented companies, regardless of any other operating differences.
Cash Turnover Ratio Calculator
We’ll now move to a modeling exercise, which you can access by filling out the form below.
Cash Turnover Ratio Calculation Example
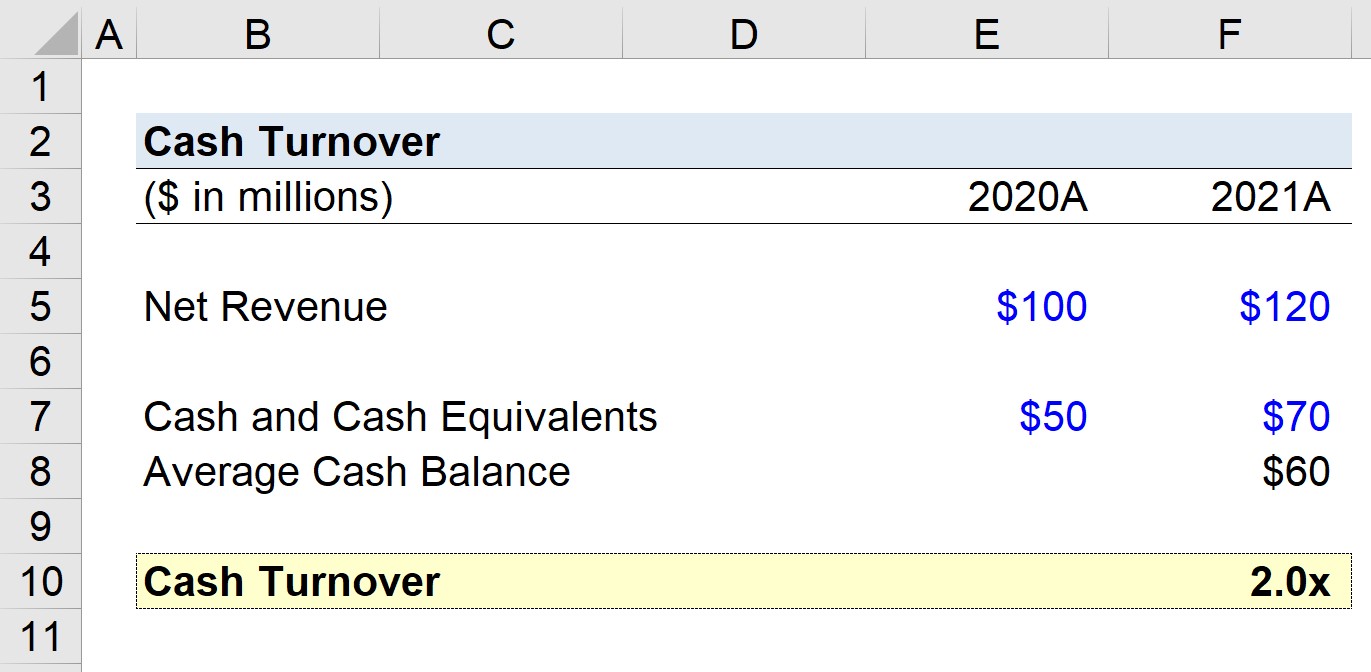
Suppose we’re tasked with calculating the cash turnover ratio of a company that generated $100 million of net revenue in 2020 and $120 million in 2021.
- Net Revenue, 2020 = $100 million
- Net Revenue, 2021 = $120 million
We’ll assume that our company possessed $50 million in cash in 2020, and then $70 million in 2021.
- Cash and Cash Equivalents, 2020 = $50 million
- Cash and Cash Equivalents, 2021 = $70 million
The average cash balance from 2020 to 2021 is $60 million, which we calculated using the formula below.
- Average Cash and Cash Equivalents = ($50 million + $70 million) ÷ 2 = $60 million
For our final step, we’ll divide our company’s net revenue in 2021 by our average cash balance to arrive at a cash turnover of 2.0x.
- Cash Turnover Ratio = $120 million ÷ $60 million = 2.0x
The 2.0x cash turnover we calculated in our hypothetical scenario must now be compared internally across the company’s past performance, as well as against its industry peers.

Everything You Need To Master Financial Modeling
Enroll in The Premium Package: Learn Financial Statement Modeling, DCF, M&A, LBO and Comps. The same training program used at top investment banks.
Enroll Today


