
- What is Asset Turnover Ratio?
- How to Calculate Asset Turnover Ratio
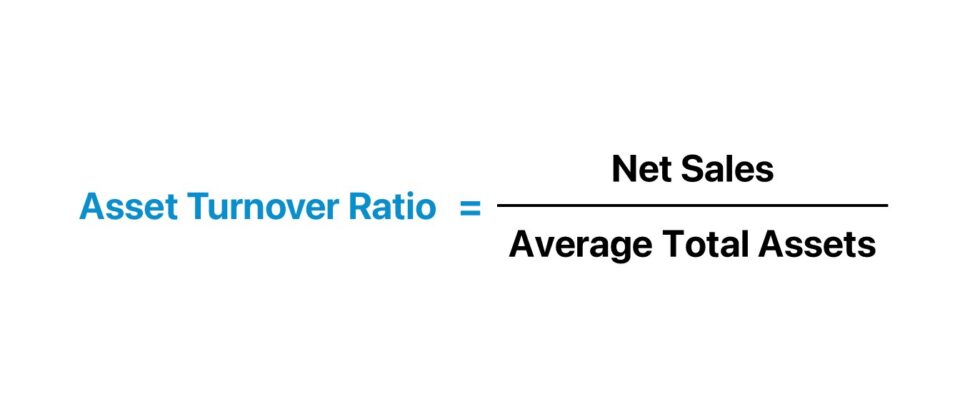
- Total Asset Turnover Ratio Formula
- Fixed Asset Turnover Ratio Formula
- What is a Good Asset Turnover Ratio?
- How to Analyze Asset Turnover Ratio by Industry
- Asset Turnover Ratio Calculator — Excel Template
- 1. Balance Sheet Assumptions
- 2. Total Asset Turnover Calculation Example
- 3. Fixed Asset Turnover Calculation Example
What is Asset Turnover Ratio?
The Asset Turnover Ratio is a financial metric that measures the efficiency at which a company utilizes its asset base to generate sales.
How to Calculate Asset Turnover Ratio
The asset turnover ratio is calculated by dividing the net sales of a company by the average balance of the total assets belonging to the company.
- Net Sales ➝ The gross sales of a company deducted by discounts, allowances, and returns.
- Average Total Assets ➝ The average between the beginning and end of period asset balances
If management’s operating capital spending has been inefficient, the company is most likely losing out on potential sales due to the misallocation of capital, which will eventually show up on its financials via lower profitability and free cash flow.
Generally, the higher the asset turnover ratio, the better, as this suggests that the company is producing more sales per dollar of asset owned (i.e., faster conversion into “turnover” or revenue) and is an indication of being better at putting its assets to use.
Unless specified otherwise, the asset turnover metric answers the question, “How much in revenue does the company generate per dollar of assets owned?”
For instance, if the total turnover of a company is 1.0x, that would mean the company’s net sales are equivalent to the average total assets in the period. In other words, this company is generating $1.00 of sales for each dollar invested into all assets.
Total Asset Turnover Ratio Formula
The formula to calculate the total asset turnover ratio is net sales divided by average total assets.
Where:
- Net Sales = Gross Sales – Returns – Discounts – Allowances
- Average Total Assets = (Beginning Total Assets + Ending Total Assets) ÷ 2
While the income statement measures a metric across two periods, balance sheet items reflect values at a certain point in time.
Hence, we use the average total assets across the measured net sales period in order to align the timing between both metrics.
Fixed Asset Turnover Ratio Formula
One common variation—termed the “fixed asset turnover ratio”—includes only long-term fixed assets (PP&E) in the calculation, as opposed to all assets.
The fixed asset turnover ratio formula divides a company’s net sales by the value of its average fixed assets.
Where:
- Net Sales = Gross Sales – Returns – Discounts – Allowances
- Average Fixed Assets = (Beginning Fixed Assets + Ending Fixed Assets) ÷ 2
The fixed asset turnover ratio is intended to isolate the efficiency at which a company uses its fixed asset base to generate sales (i.e. capital expenditure).
Hence, it is often used as a proxy for how efficiently a company has invested in long-term assets.
Considering how costly the initial purchase of PP&E and maintenance can be, each spending decision towards these long-term investments should be made carefully to lower the chance of creating operating inefficiencies.
What is a Good Asset Turnover Ratio?
Irrespective of whether the total or fixed variation is used, the asset turnover ratio is not practical as a standalone metric without a point of reference.
The asset turnover ratio is most helpful when compared to that of industry peers and tracking how the ratio has trended over time.
- Low Asset Turnover Ratio ➝ Often indicates excess production capacity or inefficient inventory management
- High Asset Turnover Ratio ➝ Suggests the company is allocating capital and deriving more benefits from its assets
Comparisons of the ratio among companies are going to be most meaningful among those within the same vertical or industry, and setting the parameters to determine what should be considered “high” or “low” ratios should be made within a specific industry context.
Over time, positive increases in the fixed asset turnover ratio can serve as an indication that a company is gradually expanding into its capacity as it matures (and the reverse for decreases across time).
Companies should strive to maximize the benefits received from their assets on hand, which tends to coincide with the objective of minimizing any operating waste.
On the flip side, a turnover ratio far exceeding the industry norm could be an indication that the company should be spending more and might be falling behind in terms of development.
Thus, a sustainable balance must be struck between being efficient while also spending enough to be at the forefront of any new industry shifts.
As with all financial ratios, a closer look is necessary to understand the company-specific factors that can impact the ratio. Such ratios should be viewed as indicators of internal or competitive advantages (e.g., management asset management) rather than being interpreted at face value without further inquiry.
How to Analyze Asset Turnover Ratio by Industry
One critical consideration when evaluating the ratio is how capital-intensive the industry that the company operates in is (i.e., asset-heavy or asset-lite).
For example, a company may have made significant asset purchases in anticipation of coming growth or have gotten rid of non-core assets in anticipation of stagnating or declining growth – and either change could artificially increase or decrease the ratio.
Companies with fewer assets on their balance sheet (e.g., software companies) tend to have higher ratios than companies with business models that require significant spending on assets.
The turnover metric falls short, however, in being distorted by significant one-time capital expenditures (Capex) and asset sales.
If you are assessing another company’s financials or attempting to determine the right amount of capital to allocate for your business, you can obtain the most useful information by comparing your company’s ratio to that of industry peers.
Additionally, you can track how your investments into ordering new assets have performed year-over-year to see if the decisions paid off or require adjustments going forward.
To reiterate from earlier, the average turnover ratio varies significantly across different sectors, so it makes the most sense for only ratios of companies in the same or comparable sectors to be benchmarked.
Asset Turnover Ratio Calculator — Excel Template
We’ll now move to a modeling exercise, which you can access by filling out the form below.
1. Balance Sheet Assumptions
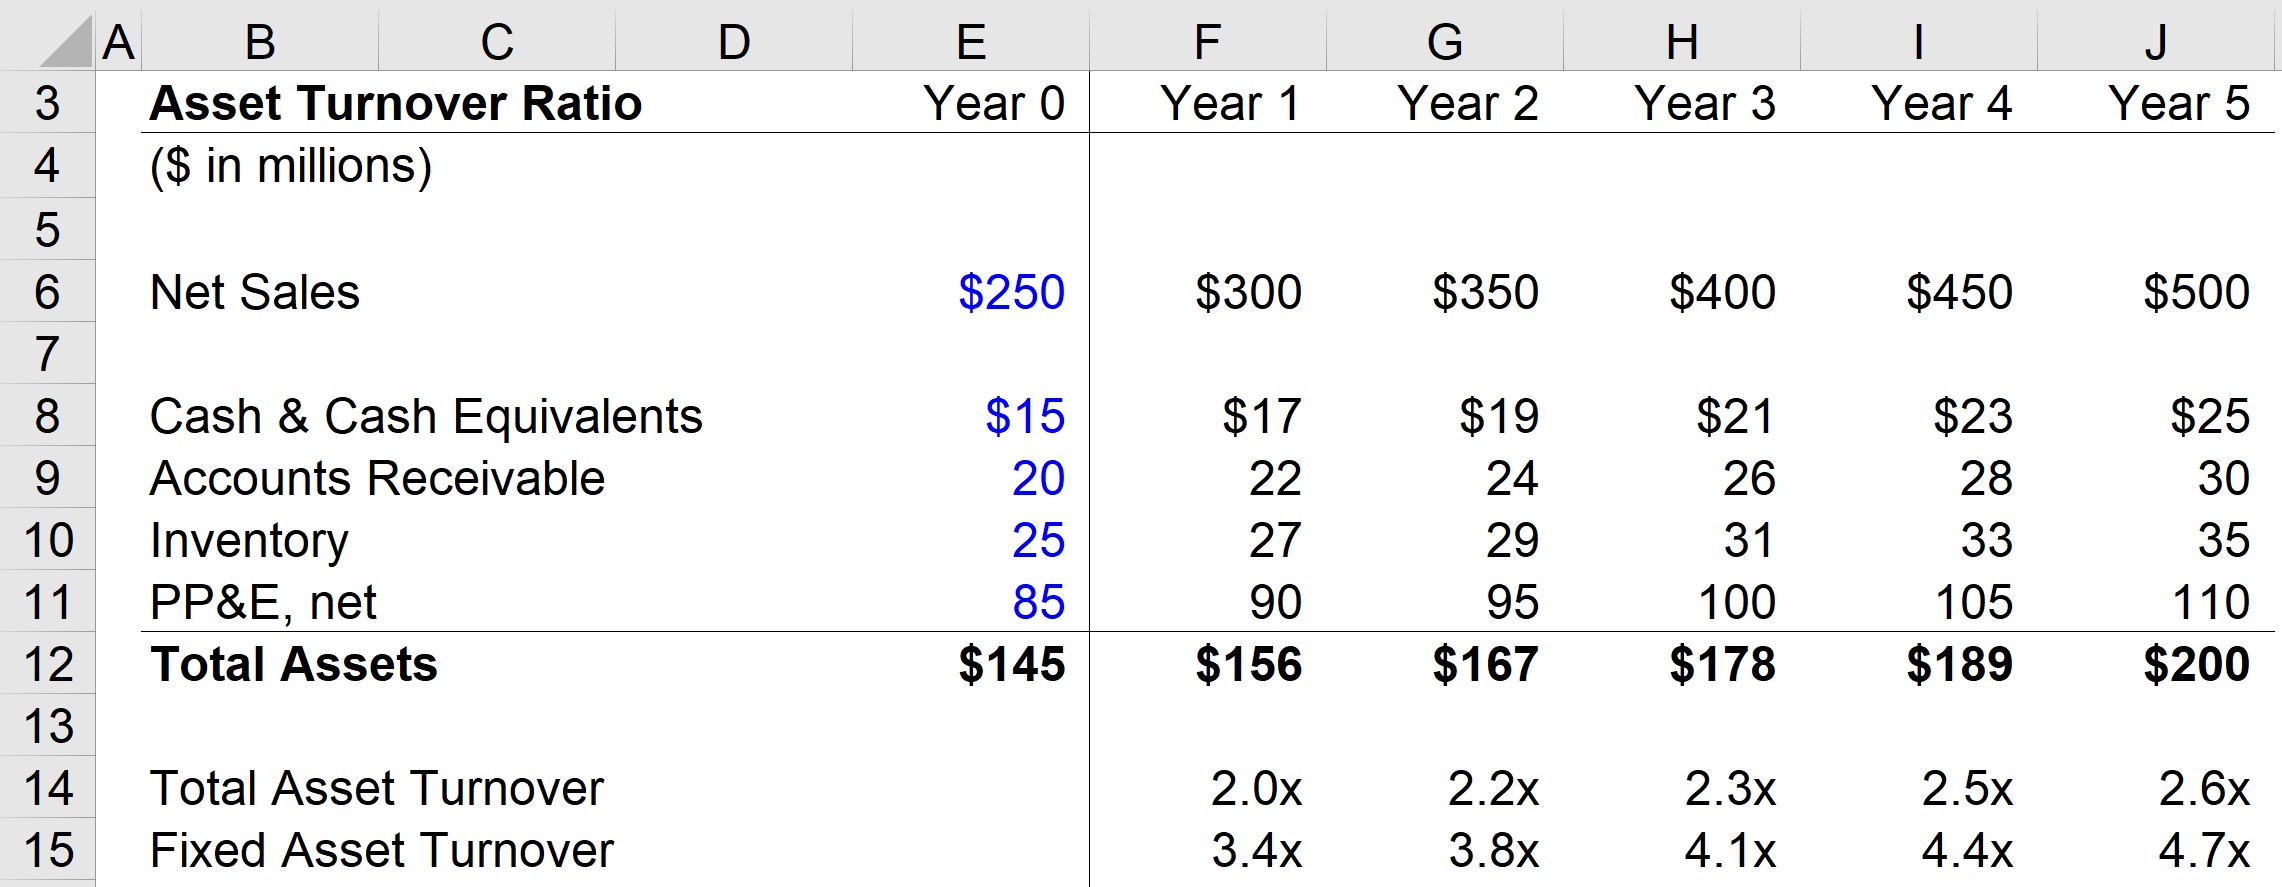
Suppose a company generated $250 million in net sales, which is anticipated to increase by $50m each year.
Moreover, the company has three types of current assets—cash and cash equivalents, accounts receivable, and inventory—with the following carrying values recorded on the balance sheet.
Financial Data (Year 0)
- Cash and Cash Equivalents = $15m
- Accounts Receivable = $20m
- Inventory = $25m
For the entire forecast, each of the current assets will increase by $2m. As a quick example, the company’s A/R balance will grow from $20m in Year 0 to $30m by the end of Year 5.
For the final step in listing out our assumptions, the company has a PP&E balance of $85m in Year 0, which is expected to increase by $5m each period and reach $110m by the end of the forecast period.
2. Total Asset Turnover Calculation Example
We now have all the required inputs, so we’ll take the net sales for the current period and divide it by the average asset balance of the prior and current periods.
To calculate the ratio in Year 1, we’ll divide Year 1 sales ($300m) by the average between the Year 0 and Year 1 total asset balances ($145m and $156m).
Upon doing so, we get 2.0x for the total asset turnover.
- Total Asset Turnover Ratio, Year 1 = $300 million ÷ AVERAGE($145 million, $156 million) = 2.0x
3. Fixed Asset Turnover Calculation Example
Once this same process is done for each year, we can move on to the fixed asset turnover, where only PP&E is included rather than all the company’s assets.
For Year 1, we’ll divide Year 1 sales ($300m) by the average between the Year 0 and Year 1 PP&E balances ($85m and $90m), which comes out to a ratio of 3.4x.
- Fixed Asset Turnover Ratio = $300 million ÷ AVERAGE($85million, $90 million) = 2.0x
Considering that the total turnover ratio increased from 2.0x in Year 1 to 2.6x in Year 5 while the fixed turnover ratio increased from 3.4x to 4.7x during the same time horizon, these positive trends could be interpreted as the company using its assets more efficiently over time.
For a more practical assessment, however, the relevant market data on industry peers is required – including the specific details regarding the company’s asset management plans and recent operating changes – to confirm the validity of the findings compiled from analyzing its asset turnover ratio.

Everything You Need To Master Financial Modeling
Enroll in The Premium Package: Learn Financial Statement Modeling, DCF, M&A, LBO and Comps. The same training program used at top investment banks.
Enroll Today")
")


