 Skip to main content
What is the Average Collection Period?
The Average Collection Period represents the number of days that a company needs to collect cash payments from customers that paid on credit.
How to Calculate Average Collection Period
The average collection period measures a company’s efficiency at converting its outstanding accounts receivable (A/R) into cash on hand.
On the balance sheet, the accounts receivable (A/R) line item is a current asset that captures the value of owed payments from customers to a company for products and/or services already delivered, i.e. an “IOU” from customers who paid using credit as opposed to cash upfront.
Since the collection period refers to the number of days it takes a company on average to collect cash from credit purchases, companies strive to reduce the time needed as they mature to increase their near-term liquidity.
- Shorter Collection Period → Efficient A/R Collection Process
- Longer Collection Period → Inefficient A/R Collection Process
Thus, the average collection period signals the effectiveness of a company’s current credit policies and A/R collection practices.
If a company is incapable of quickly obtaining cash from customers for goods/services already delivered (and “earned”), the company might need to implement changes to its policies to counteract the time lag between delivery and cash receipt.
In short, the average collection period answers the question:
- “How many days does it require a company to receive its owed cash payment from credit purchases?”
Therefore, the working capital metric is considered to be a measure of liquidity risk.
- Less Accounts Receivable Outstanding → More Short-Term Liquidity
- More Accounts Receivable Outstanding → Less Short-Term Liquidity
In order to calculate the average collection period, the company’s accounts receivable (A/R) carrying values from its balance sheet are needed along with its revenue in the corresponding period.
More specifically, the company’s credit sales should be used, but such specific information is not usually readily available.
Average Collection Period Formula
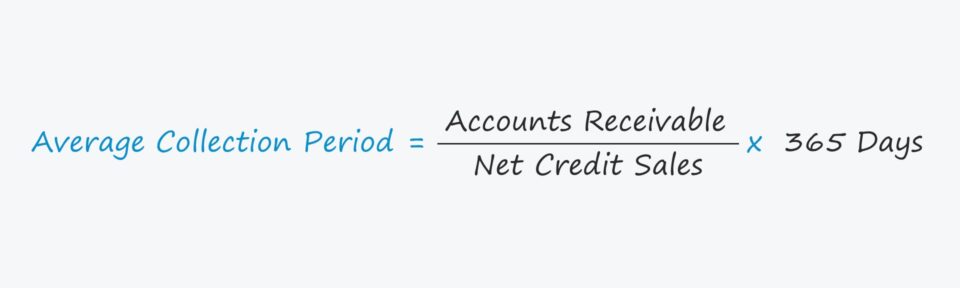
The formula for calculating the average collection period is as follows.
The calculation involves dividing a company’s A/R by its net credit sales and then multiplying by the number of days in a year, in which either 360 days or 365 days can be used.
Because revenue is from the income statement, a financial statement that covers a period of time, whereas A/R is from the balance sheet, a “snapshot” at a point in time — it is acceptable to use the average A/R balance.
However, using the average balance creates the need for more historical reference data.
As an alternative, the metric can also be calculated by dividing the number of days in a year by the company’s receivables turnover.
The receivables turnover estimates the number of times that a company collects owed cash payments from customers per year, and is calculated as the ratio between the company’s credit sales and its average A/R balance.
Average Collection Period — Excel Template
We’ll now move to a modeling exercise, which you can access by filling out the form below.
Average Collection Period Example Calculation
Suppose a company generated $280k and $360k in net credit sales for the fiscal years ending 2020 and 2021, respectively.
In 2020, the company’s ending accounts receivable (A/R) balance was $20k, which grew to $24k in the subsequent year.
2020A
- Net Credit Sales = $280k
- Accounts Receivable (A/R) = $20k
2021A
- Net Credit Sales = $360k
- Accounts Receivable (A/R) = $24k
We’ll use the ending A/R balance for our calculations here and assume the number of days in the period is 365 days.
If the average A/R balances were used instead, we would require more historical data.
Using those assumptions, we can now calculate the average collection period by dividing A/R by the net credit sales in the corresponding period and multiplying by 365 days.
- 2020A = ($20k ÷ $280k) × 365 Days = 26 Days
- 2021A = ($24k ÷ $360k) × 365 Days = 24 Days
From 2020 to 2021, the average number of days needed by our hypothetical company to collect cash from credit sales declined from 26 days to 24 days, reflecting an improvement year-over-year (YoY).
In the next part of our exercise, we’ll calculate the average collection period under the alternative approach of dividing the receivables turnover by the number of days in a year.
- 2020A = $280k ÷ $20k = 14.0x
- 2021A = $360k ÷ $24k = 15.0x
Upon dividing the receivables turnover ratio by 365, we arrive at the same implied collection periods for both 2020 and 2021 — confirming our prior calculations were correct.
- 2020A = 365 Days ÷ 14.0x = 26 Days
- 2021A = 365 Days ÷ 15.0x = 24 Days


Everything You Need To Master Financial Modeling
Enroll in The Premium Package: Learn Financial Statement Modeling, DCF, M&A, LBO and Comps. The same training program used at top investment banks.
Enroll Today


