
What is Average Inventory Period?
The Average Inventory Period is the approximate number of days it takes a company to cycle through its inventory.
How to Calculate Average Inventory Period
The average inventory period, or days inventory outstanding (DIO), is a ratio used to measure the duration needed by a company to sell out its entire stock of inventory.
A company’s management team tracks the average inventory period to monitor its inventory management and ensure orders are placed based on customer purchasing patterns and sales trends.
In effect, the efficient management of inventory results in fewer days, i.e. finished goods spend less time sitting in storage waiting to be sold.
Until the inventory is sold and converted into cash, the cash cannot be used by the company, because the cash is tied up as working capital.
There are two inputs required to calculate the working capital metric:
- Number of Days in Period = 365 Days
- Inventory Turnover = Cost of Goods Sold (COGS) ÷ Average Inventory
The average inventory equals the sum of the current period and prior period ending inventory balance, divided by two.
- Average Inventory = (Ending Inventory + Beginning Inventory) ÷ 2
Average Inventory Period Formula
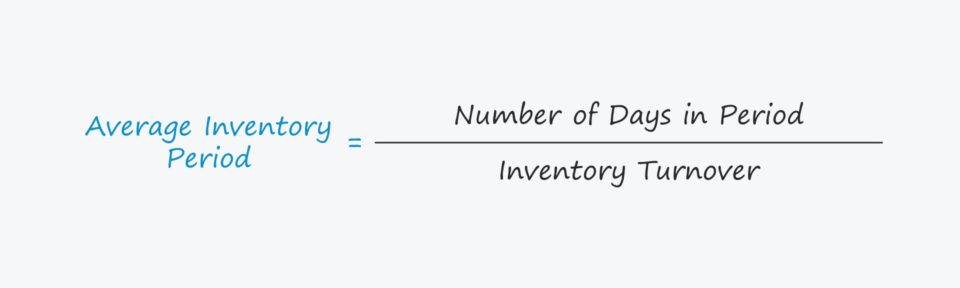
The formula for calculating the average inventory period is as follows.
Formula
- Average Inventory Period = Number of Days in Period ÷ Inventory Turnover
Unless analysis of a company’s near-term liquidity is the reason for tracking the metric (i.e. distressed companies), most calculations are performed on an annual basis, where the number of days in an annual period would be 365 days.
The formula for calculating the inventory turnover, as mentioned earlier, is COGS divided by the average inventory balance.
COGS is a line item on the income statement, which covers financial performance over time, whereas inventory is taken from the balance sheet.
Average Inventory
Unlike the income statement, the balance sheet is a snapshot of a company’s assets, liabilities, and equity at a specific point in time.
Considering the mismatch in timing, the solution is to use the average inventory balance, which is the average between the beginning-of-period and end-of-period inventory carrying values according to the company’s B/S.
How to Interpret Average Inventory Period
The less inventory build-up there is, the more free cash flow (FCF) a company generates – all else being equal.
Most companies strive to reduce their average inventory period over time, as it is generally accepted that a lower days inventory outstanding (DIO) indicates greater operating efficiency.
A reduction in the time that inventory spends in storage signifies that the company is turning its inventory stock into cash more quickly, which is typically as a result of understanding customer behavior, cyclical or seasonal trends, and/or leveraging data to place orders accordingly.
For the most part, a lower duration is perceived more favorably because it implies a company can sell its finished goods efficiently without stockpiling inventory.
If a company reduces the amount of time between the date of the initial inventory purchase and conversion of a marketable finished good into revenue, the result is greater free cash flow (FCF) – all else being equal.
More discretionary FCFs enable companies to allocate more capital to reinvestments such as capital expenditures to drive future growth, as well as perform other actions such as the early repayment of debt.
In contrast, if the average duration needed by a company to clear out its inventory stock is abnormally high relative to its industry peers, the following factors could potentially be the explanation.
- Lack of Customer Demand in Target Market
- Ineffective Product Pricing Strategy
- Sub-Par Marketing and Advertising Initiatives
Average Inventory Period Calculator – Excel Template
We’ll now move to a modeling exercise, which you can access by filling out the form below.
Average Inventory Period Calculation Example
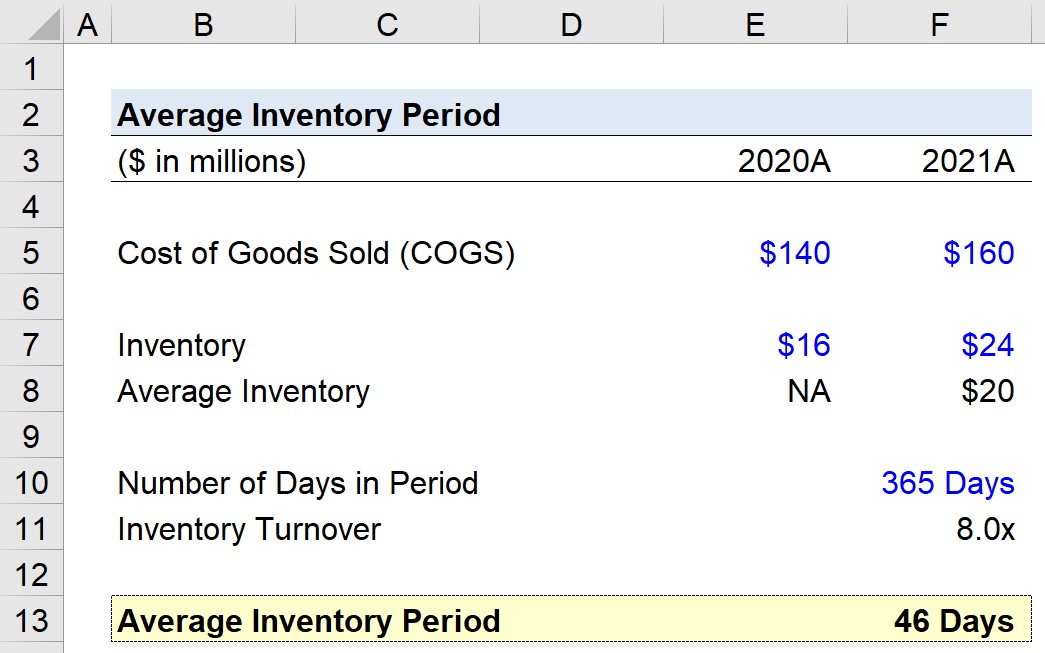
Suppose that during a two-year time span from 2020 to 2021, a company’s cost of goods sold (COGS) was $140 million and $160 million, respectively.
- COGS, 2020 = $140 million
- COGS, 2021 = $160 million
On the company’s balance sheet, the ending values reported for inventory are $16 million and $24 million in the year afterward, so the average inventory is $20 million.
- Inventory, 2020 = $16 million
- Inventory, 2021 = $24 million
- Average Inventory = ($16 million + $24 million) ÷ 2 = $20 million
The inventory turnover – i.e. the frequency at which a company cycles through its inventory stock – is 8.0x, which we calculated by dividing COGS in 2021 by the average inventory.
- Inventory Turnover = $160 million ÷ 20 million = 8.0x
Using the inputs we’ve gathered so far, our final step is to divide the number of days in the period (i.e. 365 days) by the inventory turnover.
- Average Inventory Period = 365 Days ÷ 8.0x = 46 Days
Since the average inventory period measures the number of days it takes on average before a company needs to replace its inventory stock, our model implies our hypothetical company must replenish its inventory every 46 days.

Everything You Need To Master Financial Modeling
Enroll in The Premium Package: Learn Financial Statement Modeling, DCF, M&A, LBO and Comps. The same training program used at top investment banks.
Enroll Today


