
What is Stock Turnover Ratio?
The Stock Turnover Ratio measures the frequency at which a company must replace its inventory on hand over a given time horizon.
How to Calculate Stock Turnover Ratio
The stock turnover ratio is a method to measure a company’s operating efficiency at converting its inventory purchases into customer sales.
The term “stock” refers to the inventory owned by a company and is recorded as a current asset on the balance sheet, as the company expects to cycle through this inventory within the next twelve months.
- Raw Materials
- Work in Progress (WIP)
- Finished Goods
Since the stock turnover ratio counts the number of times that a company needed to replenish its inventory, a higher ratio implies that the company is converting inventory purchases into revenue more efficiently (and vice versa for a lower turnover ratio).
The stock turnover ratio of a company can be compared relative to historical trends (i.e. in a year-over-year analysis) – as well as to that of its industry peer group – which are both practical methods to derive insights into the management team’s inventory management decisions and future business trajectory.
The steps to calculate the stock turnover ratio are as follows:
- Calculate Average Inventory (Beginning and End of Period Balance)
- Divide Cost of Goods Sold (COGS) by Average Inventory
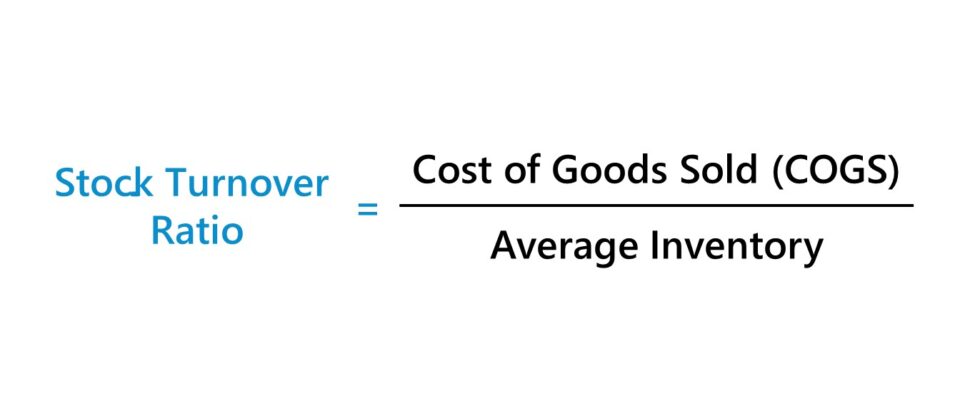
Stock Turnover Ratio Formula
The formula to calculate the stock turnover ratio is cost of goods sold (COGS) divided by average inventory.
The calculation of the stock turnover ratio consists of dividing the cost of goods sold (COGS) incurred by the average inventory balance for the corresponding period.
- Cost of Goods Sold (COGS) ➝ COGS refers to the operating costs directly related to the generation of revenue and can be found on the income statement, where it is the first deduction from revenue (i.e. the “top line”)
- Inventory ➝ The carrying balance of a company’s inventory can be found on the balance sheet. The average inventory balance is determined by dividing the sum of the beginning and ending inventory balances by two.
Because an income statement line item is being compared to a balance sheet item, there is a mismatch created between the time period covered by the numerator and denominator. Hence, the usage of the average inventory balance in this case.
If using the average inventory balance, both the beginning and end of period balance sheets are necessary.
Otherwise, the ending balance can be used instead. In most cases, the difference between using the ending or average balance is negligible, and the high-level takeaways should be virtually identical – assuming there were no major shifts in the business model and inventory management practices during the given time period.
What is a Good Stock Turnover Ratio?
A high ratio of inventory turnover and the need to order more frequently goes hand-in-hand with strong customer demand and efficient inventory management (i.e. demand planning).
Given that the stock turnover ratio tracks the number of times that a company’s inventory balance is cleared out and needs to be replaced over a specified period, companies typically aim to raise their turnover ratio.
- High Stock Turnover Ratio → Strong Customer Demand in Market + Efficiency Inventory Management
- Low Stock Turnover Ratio → Weak Customer Demand in Market + Excess Inventory
The build-up of excess inventory tends to be perceived negatively, as it often stems from overstocking and a poor understanding of customer spending behavior.
If the company’s inventory remains unsold, management might eventually decide to write down some of its inventory value to better reflect the fair value on the balance sheet (or all of the value could be wiped in a write-off).
However, the context must also be closely considered, such as confirming that the time from customer order to delivery is on par or above that of industry comparables.
For instance, ordering less inventory might improve the turnover ratio, yet doing so is at the cost of missing out on potential revenue and the heightened risk of falling behind competitors with regard to order fulfillment and customer satisfaction.
Stock Turnover Ratio vs. Days Inventory Outstanding (DIO)
The stock turnover ratio is closely related to the days inventory outstanding (or “inventory days”).
The days inventory outstanding (DIO) metric measures the amount of time required by a company to sell off its inventory in its entirety.
The relationship between the stock turnover ratio and days inventory outstanding (DIO) is as follows:
While most companies strive for a higher stock turnover ratio, a lower days inventory outstanding (DIO) is preferred because that means a company’s inventory remains in its possession for a shorter duration of time on average.
In contrast, a lower stock turnover ratio coincides with a prolonged period between the inventory purchase date, production or manufacturing of the raw material into a finished good, and the date of the completed customer sale.
Stock Turnover Ratio Calculator
We’ll now move to a modeling exercise, which you can access by filling out the form below.
Stock Turnover Ratio Calculation Example
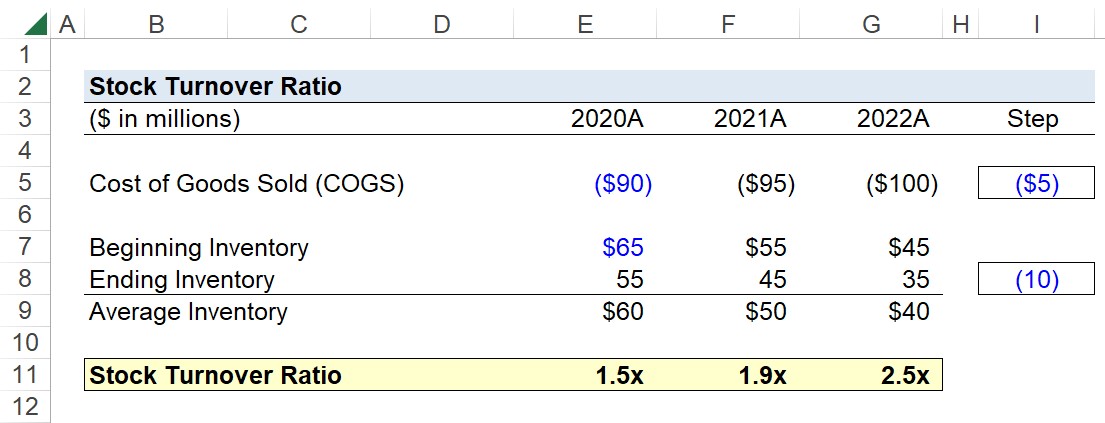
Suppose we’re tasked with calculating the stock turnover ratio for a consumer retail company using the following financial assumptions.
| Financial Data | 2020A | 2021A | 2022A |
|---|---|---|---|
| Cost of Goods Sold (COGS) | ($90 million) | ($95 million) | ($100 million) |
| Beginning Inventory | $65 million | $55 million | $45 million |
| Ending Inventory | $55 million | $45 million | $35 million |
Our first step is to determine the average inventory balance for each period.
- Average Inventory, 2020A = $60 million
- Average Inventory, 2021A = $50 million
- Average Inventory, 2022A = $40 million
Since the cost of goods sold (COGS) was provided, the next step is to divide the COGS incurred each period by the average inventory balance.
In closing, the stock turnover ratio of our hypothetical company was 1.5x, 1.9x, and 2.5x from 2020 to 2022.
- Stock Turnover, 2020A = $90 million ÷ $60 million = 1.5x
- Stock Turnover, 2021A = $95 million ÷ $50 million = 1.9x
- Stock Turnover, 2022A = $100 million ÷ $40 million = 2.5x

Everything You Need To Master Financial Modeling
Enroll in The Premium Package: Learn Financial Statement Modeling, DCF, M&A, LBO and Comps. The same training program used at top investment banks.
Enroll Today


