Skip to main content
What is Growth Rate?
The Growth Rate reflects the percentage change in a metric, such as the population or sales, across a specified time frame.
How to Calculate Growth Rate
The growth rate measures the rate of change in the value of a specific metric across a given time period, expressed as a percentage.
Common examples of real-life, practical scenarios where the growth rate is often used include the following:
- Company Sales (or Revenue)
- Net Operating Income (NOI)
- EBITDA
- Free Cash Flow (FCF)
- Population Figures
- Gross Domestic Product (GDP)
- Inflation Rate (CPI)
Under the specific context of financial modeling, the growth rate is most frequently on a quarterly or annual basis, i.e. year-over-year (YoY).
More defensible predictions can be made about the future trajectory of a metric in question by determining its historical growth, which can serve as a practical point of reference for forecasting purposes.
However, the metric’s usefulness is still tied to the extent that the underlying drivers are identified and researched in-depth.
By itself, the historical growth rate is insufficient because what truly contributed toward the past growth—i.e. the underlying fundamentals and qualitative factors—are far more likely to provide insights to forecast a metric’s pro forma growth trajectory.
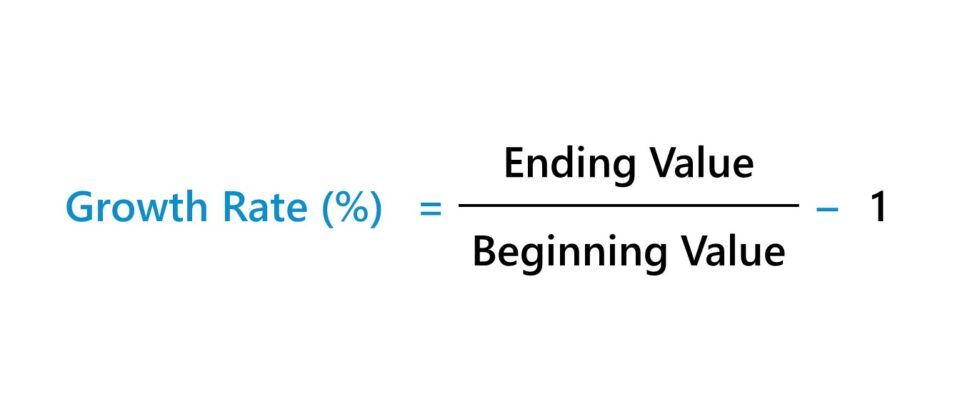
Growth Rate Formula
The formula to calculate the growth rate across two periods is equal to the ending value divided by the beginning value, subtracted by one.
For example, if a company’s revenue was $100 million in 2023 and grew to $120 million in 2024, its year-over-year (YoY) growth rate is 20%.
- Growth Rate = ($120 million ÷ $100 million) – 1 = 0.20, or 20%
The Wharton Online & Wall Street Prep Applied Value Investing Certificate Program
Learn how institutional investors identify high-potential undervalued stocks. Enrollment is open for the upcoming cohort.
Enroll TodayHow to Annualize the Growth Rate
Often, we’ll want to annualize the rate of growth (i.e. “smooth out” the rate of growth across several periods), which can be done by calculating the compound annual growth rate (CAGR).
The CAGR is the annualized growth rate over a specified period, i.e. a single growth rate that treats all the past changes as if they occurred evenly across the entire duration of time covered.
CAGR is conceptually the annual rate of return needed for the initial value of a metric to grow from its current value to its ending value between the two specified dates.
The three inputs necessary to compute the CAGR are listed below.
- Beginning Value (or Present Value)
- Ending Value (or Future Value)
- Number of Periods
Calculating the CAGR involves dividing the ending value by the beginning value, raising the resulting figure to the inverse number of periods (1 ÷ the number of periods), and subtracting one.
Note: The number of periods refers to the number of compounding periods.
Growth Rate Calculator
We’ll now move to a modeling exercise, which you can access by filling out the form below.
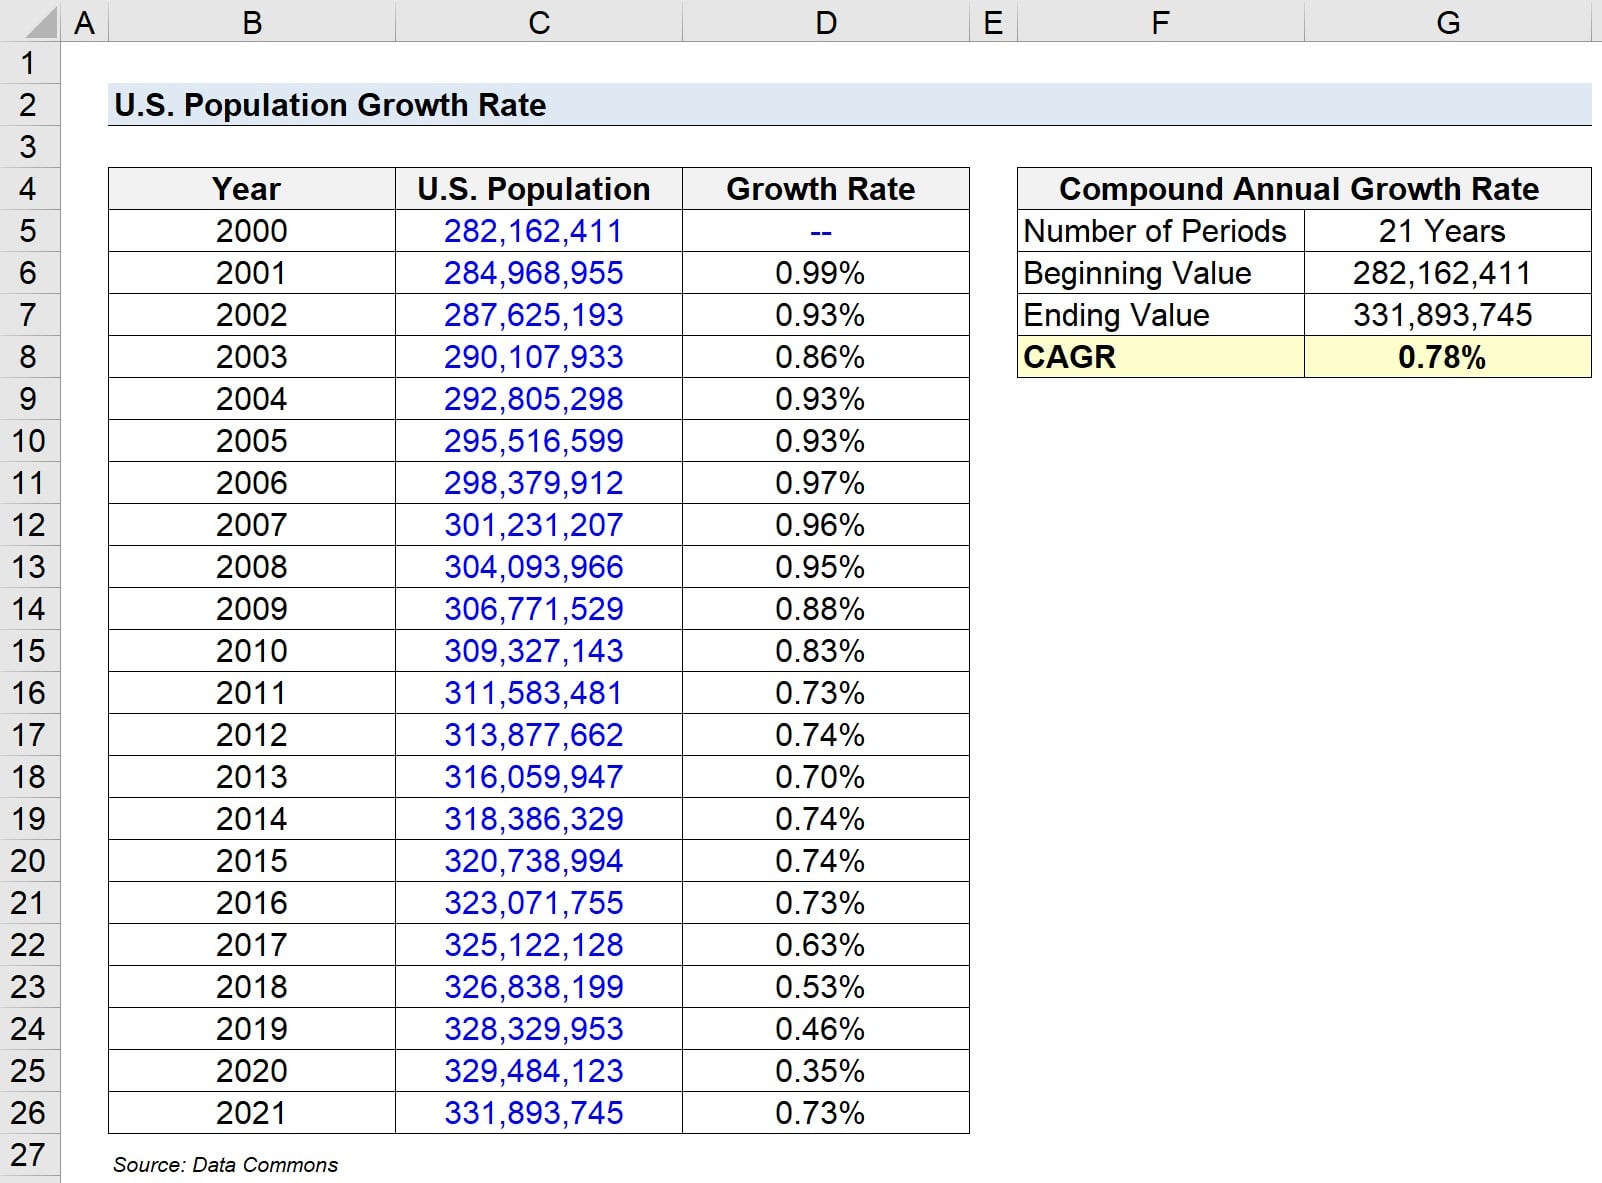
1. US Population Statistics Assumptions
Suppose we’re attempting to evaluate the growth of the U.S. population.
The data set we’re working with – pulled from Data Commons – can be found below.
| Year | U.S. Population |
|---|---|
| 2000 | 282,162,411 |
| 2001 | 284,968,955 |
| 2002 | 287,625,193 |
| 2003 | 290,107,933 |
| 2004 | 292,805,298 |
| 2005 | 295,516,599 |
| 2006 | 298,379,912 |
| 2007 | 301,231,207 |
| 2008 | 304,093,966 |
| 2009 | 306,771,529 |
| 2010 | 309,327,143 |
| 2011 | 311,583,481 |
| 2012 | 313,877,662 |
| 2013 | 316,059,947 |
| 2014 | 318,386,329 |
| 2015 | 320,738,994 |
| 2016 | 323,071,755 |
| 2017 | 325,122,128 |
| 2018 | 326,838,199 |
| 2019 | 328,329,953 |
| 2020 | 329,484,123 |
| 2021 | 331,893,745 |
Source: Data Commons
2. Growth Rate Calculation Example
To calculate the year-over-year (YoY) growth rate, we’ll divide each year by the preceding year.
For example, the formula for calculating the YoY growth in 2001 is the current population in 2021 (284,968,955) divided by the population in 2000 (282,162,411), minus one.
- 2001 YoY Growth = (284,968,955 ÷ 282,162,411) – 1 = 0.99%
The growth rates for each year are as follows.
- 2000 → 2001 = 0.99%
- 2001 → 2002 = 0.93%
- 2002 → 2003 = 0.86%
- 2003 → 2004 = 0.93%
- 2004 → 2005 = 0.93%
- 2005 → 2006 = 0.97%
- 2006 → 2007 = 0.96%
- 2007 → 2008 = 0.95%
- 2008 → 2009 = 0.88%
- 2009 → 2010 = 0.83%
- 2010 → 2011 = 0.73%
- 2011 → 2012 = 0.74%
- 2012 → 2013 = 0.70%
- 2013 → 2014 = 0.74%
- 2014 → 2015 = 0.74%
- 2015 → 2016 = 0.73%
- 2016 → 2017 = 0.63%
- 2017 → 2018 = 0.53%
- 2018 → 2019 = 0.46%
- 2019 → 2020 = 0.35%
- 2020 → 2021 = 0.73%
3. Compound Annual Growth Rate Calculation Example (CAGR)
Next, the inputs used to calculate the compound annual growth rate (CAGR) are as follows.
- Number of Periods = 21 Years
- Beginning Value = 282,162,411
- Ending Value = 331,893,745
The CAGR of the U.S. population from 2000 to 2021 comes out to 0.78%.
- CAGR = (331,893,745 ÷ 282,162,411) ^ (1 ÷ 21 Years) – 1 = 0.78%