
What is YoY?
The Year over Year (YoY) growth is the percentage change in an annualized metric over two comparable periods, most often the current and prior period.
By comparing a company’s current annual financial performance to that of 12 months back, the rate at which the company has grown as well as any cyclical patterns can be identified.
- YoY stands for “year-over-year” and measures the rate of change in a metric across two comparable periods.
- The YoY growth rate can be used to analyze the annual increase or decrease in a financial metric, such as revenue.
- The YoY metric is most often used to determine the growth rate over the prior period, i.e. the rate of growth at which the financial metric grow by to reach the ending period value.
- The formula to calculate the YoY growth rate is to divide the current period balance by the beginning period balance, and then subtracting by one.
How to Calculate YoY Growth
YoY stands for “Year-over-Year”, and measures the rate of growth in a specific metric over two comparable periods, such as the current and prior period.
The objective of performing a year over year growth analysis (YoY) is to compare recent financial performance to historical periods.
The question answered by performing a YoY growth analysis is, “Has the business been growing at a faster pace than the previous year, or has growth been slowing down in recent years?”
To calculate the YoY growth rate, the current period amount is divided by the prior period amount, and then one is subtracted to get to a percentage rate.
YoY Formula
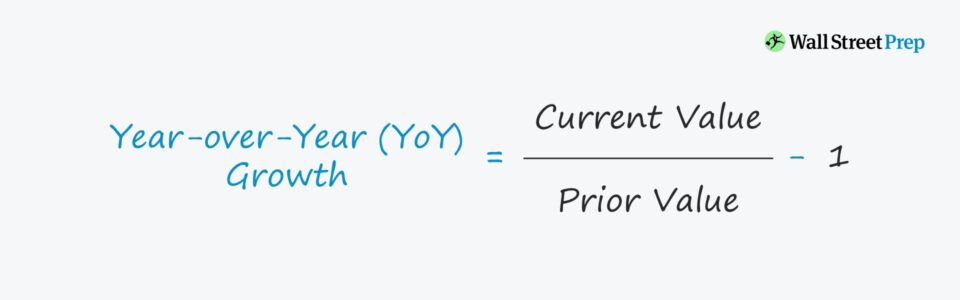
The formula used to calculate the year over year (YoY) growth divides the current period value by the prior period value, and then subtracts by one.
Where:
- Current Period → End of Period (EoP)
- Prior Period → Beginning of Period (BoP)
YoY Growth Calculation Example
For example, suppose the net operating income (NOI) of a commercial real estate property investment has grown from $25 million in Year 0 to $30 million in Year 1.
- Beginning NOI (Year 0) = $25 million
- Ending NOI (Year 1) = $30 million
- Increase / (Decrease) = $30 million – $25 million = $5 million
After inputting our assumptions into the formula, we arrive at an YoY growth rate of 20% in the net operating income (NOI) of the property.
- NOI YoY Growth (%) = ($30 million ÷ $25 million) – 1 = 20.0%
Alternatively, another method to calculate the YoY growth is to subtract the prior period balance from the current period balance, and then divide that amount by the prior period balance.
- NOI YoY Growth (%) = ($30 million – $25 million) ÷ $25 million = 20.0%
Under either approach, the year over year (YoY) growth rate in the property’s NOI is 20.0%, which reflects the percentage change between the two periods.
What is a Good YoY Growth Rate?
The main benefit of YoY growth analysis is how easy it is to track and compare growth rates across several periods. If the growth metric is annualized, the adjustment removes the impact of monthly volatility.
Furthermore, cyclical patterns become apparent if the analysis with historical results is inclusive of a minimum of one full economic cycle.
While the intuition is easy to grasp for the two basic rules, you must perform deeper diligence into the company’s growth trajectory to identify the core underlying drivers behind the change, before reaching a definitive conclusion.
- Increase in YoY Growth Rate → Positive Outlook in Growth Trajectory
- Decrease in YoY Growth Rate → Negative Outlook in Growth Trajectory
Briefly, consider a company whose revenue growth rate in the past year was 5%, but whose growth rate was merely 3% in the current year.
However, the quality of the revenue generated could have improved despite the slightly lower growth rate (e.g. longer-term contractual revenue, less churn, fewer customer acquisition costs).
On that note, it would be inaccurate to assume that the current year was necessarily “worse” than the prior year without a deeper dive analysis.
In addition, another important consideration is that growth inevitably slows down eventually for all companies.
Late-stage, mature companies with established market shares are less likely to allocate funds to facilitate more growth (e.g. reinvestment, capital expenditures).
Instead, such companies are more inclined to focus on the following types of corporate actions:
- Issue Dividends to Common Shareholders (or Preferred Shareholders)
- Integrate Changes to Improve Operating Efficiency (i.e. Higher Profit Margins, Free Cash Flow Conversion)
- Extract More Value from Existing Customer Base (Upselling / Cross-Selling)
- Increased Spending on New Customer Acquisition Strategies
- Improve Customer Retention Rate (or Reduce Customer Churn Rate)

Use AI for Deeper YoY Analysis Insights
Year-over-Year (YoY) analysis is a foundational tool in financial reporting, enabling professionals to track growth, seasonality, and operational efficiency across comparable time periods. As organizations grapple with increasingly complex datasets, artificial intelligence is proving essential in enhancing YoY analysis by streamlining data aggregation, surfacing emerging patterns, and generating predictive insights. These innovations are especially relevant in today’s financial landscape, which is why Wall Street Prep, in collaboration with Columbia Business School Executive Education, developed the AI for Business & Finance Certificate Program. By exploring how technologies like AI are reshaping growth trends, this program helps professionals rethink how they approach year-over-year performance.
YoY Growth Calculator — Excel Template
We’ll now move on to a modeling exercise, which you can access by filling out the form below.
1. Revenue Growth Rate Assumptions
Suppose we’re analyzing the growth profile of a company that generated $100 million in revenue and $25 million in operating income (EBIT) in the trailing twelve months.
Selected Financial Data (Year 0)
- Revenue (or “Sales”), Year 0 = $100 million
- Operating Income (or “EBIT”), Year 0 = $25 million
Our first step is to project the company’s revenue and operating income (EBIT) using the following assumptions.
- Revenue YoY Growth Rate = +4%
- Operating Income (EBIT) YoY Growth Rate = -3%
2. YoY Growth Calculation in Excel
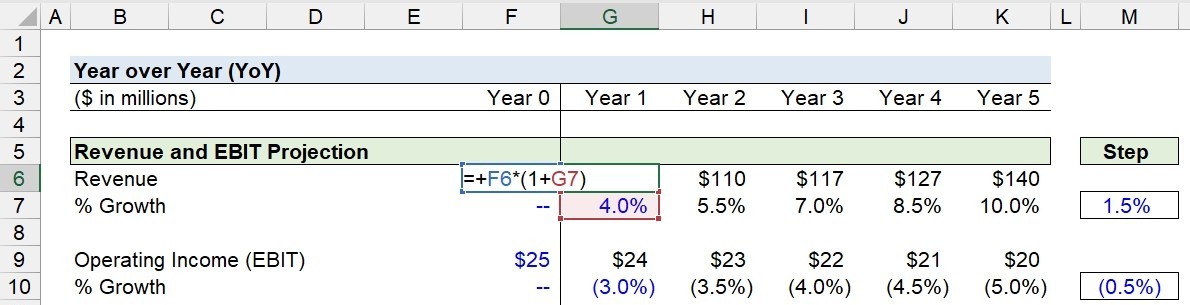
If we multiply the prior period balance by (1 + growth rate assumption), we can calculate the projected current period balance.
For example, in Year 0 (12/31/21), the revenue is $100m, so the next period’s revenue is $104m after applying the 4.0% YoY growth assumption.
- Revenue, Year 1 = $100 million × (1 + 4.0%) = $104 million
Once we perform the same process for revenue in all forecasted periods, as well as for EBIT, the next part of our modeling exercise is to calculate the YoY growth rate.
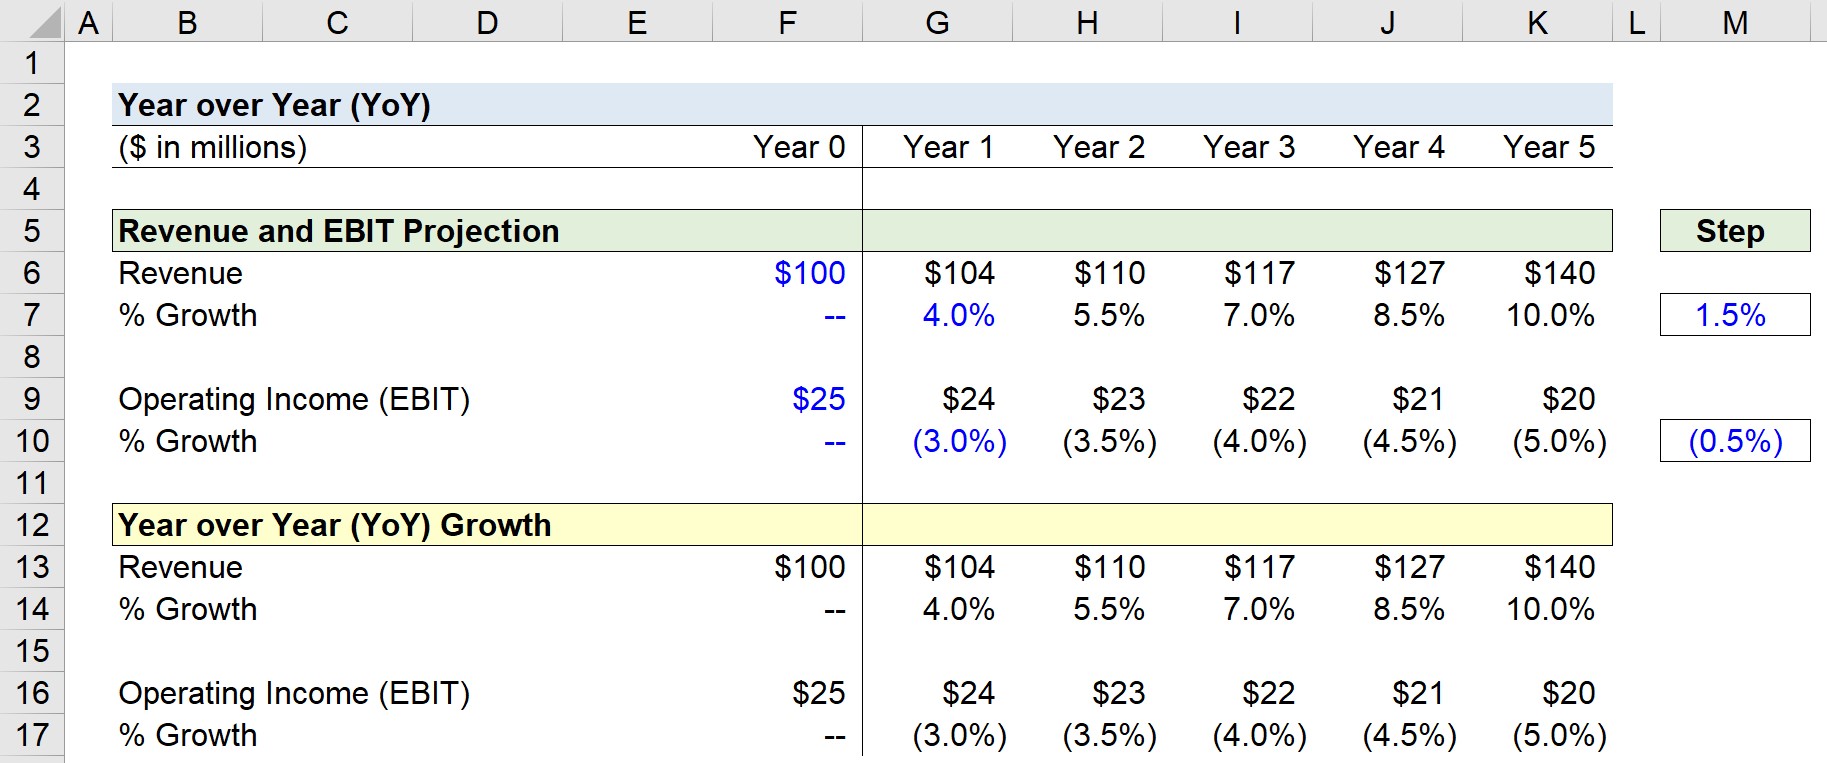
3. YoY Growth Analysis Example
Here, by dividing the current period amount by the prior period amount, and then subtracting 1, we arrive at the implied growth rate.
In Year 1, we divide $104m by $100m and subtract one to get 4.0%, which reflects the growth rate from the preceding year.
The YoY growth of our company can be analyzed for an improved understanding of its growth trajectory, the implied stage of the company’s life-cycle, and cyclical trends in operating performance.
The Wharton Online & Wall Street Prep Applied Value Investing Certificate Program
Learn how institutional investors identify high-potential undervalued stocks. Enrollment is open for the upcoming cohort.
Enroll Today")


this was really good
Thanks, Mark!
Great presentation!!!