Skip to main content
What is Month over Month Growth?
Month over Month Growth (M/M) measures the rate of change in the value of a metric on a monthly basis, expressed as a percentage of the original value.

- Month-over-month growth measures the rate of change in the value of a metric, such as revenue or active users, on a monthly basis, expressed as a percentage of the prior month's value.
- The month-over-month growth rate is distinct from the year-over-year growth rate because the metric analyzes growth on a more granular basis (i.e. periodicity is per month).
- To calculate M/M growth, divide the current month's value by the prior month's value and subtract one, or alternatively, subtract the prior month's value from the current month and divide by the prior month's value.
- The compounding monthly growth rate (CMGR) refers to the average month-over-month growth of a metric over a period of time, calculated as (Final Month Value ÷ Initial Month Value) ^ (1 ÷ # of Months) – 1.
How to Calculate Month-over-Month Growth
The month-over-month growth rate shows the change in the value of a metric – such as revenue or the number of active users – expressed as a percentage of the prior month’s value.
For mature companies, one of the main use-cases for calculating the monthly growth rate is to understand the cyclicality of a company’s performance.
The monthly growth rate is also important to track for early-stage companies, since metrics such as the run rate revenue are based on recent performance due to the high growth rates of such companies.
Calculating the month-over-month growth rate is a two-step process:
- The first step is to divide the current month’s value by the prior month’s value
- In the second step, one is subtracted from the result from the previous step
Month-over-Month Growth Formula
The monthly growth rate formula divides the current month value by the prior month value, which is then subtracted by one.
The result will be in the form of a fraction, so the resulting value must then be multiplied by 100 to express the metric as a percentage.
Another method to calculate the monthly growth rate is to subtract the prior month’s value from the current month’s value and then divide it by the prior month’s value.
For instance, let’s consider if a company had 200 active users in January and 240 in February.
Using the equation below, we can calculate that the monthly growth rate in active users was 20%.
- Monthly Growth Rate = (240 / 200) – 1 = 0.20, or 20%
The Wharton Online & Wall Street Prep Applied Value Investing Certificate Program
Learn how institutional investors identify high-potential undervalued stocks. Enrollment is open for the upcoming cohort.
Enroll TodayCompound Monthly Growth Rate Formula (CMGR)
The compounding monthly growth rate (CMGR) refers to the average month-over-month growth of a metric.
The CMGR formula is shown below.
For example, let’s say a mobile application company is attempting to calculate the CMGR of its monthly active users (MAUs).
At the end of January 2022, there was a total of 10,000 users, which grew to 20,000 active users by the end of December 2022.
If we enter those assumptions into the formula, we calculate 6.5% as the CMGR. The interpretation is that on average, between January and December 2022, users grew by 6.5% per month.
- CMGR = 20,000 ÷ 10,000 ^(1/11) – 1 = 6.5%
Month-over-Month Growth Calculator — Excel Template
We’ll now move to a modeling exercise, which you can access by filling out the form below.
Month-over-Month Growth Calculation Example
Suppose you’re tasked with calculating the monthly growth rate of a company’s active user base.
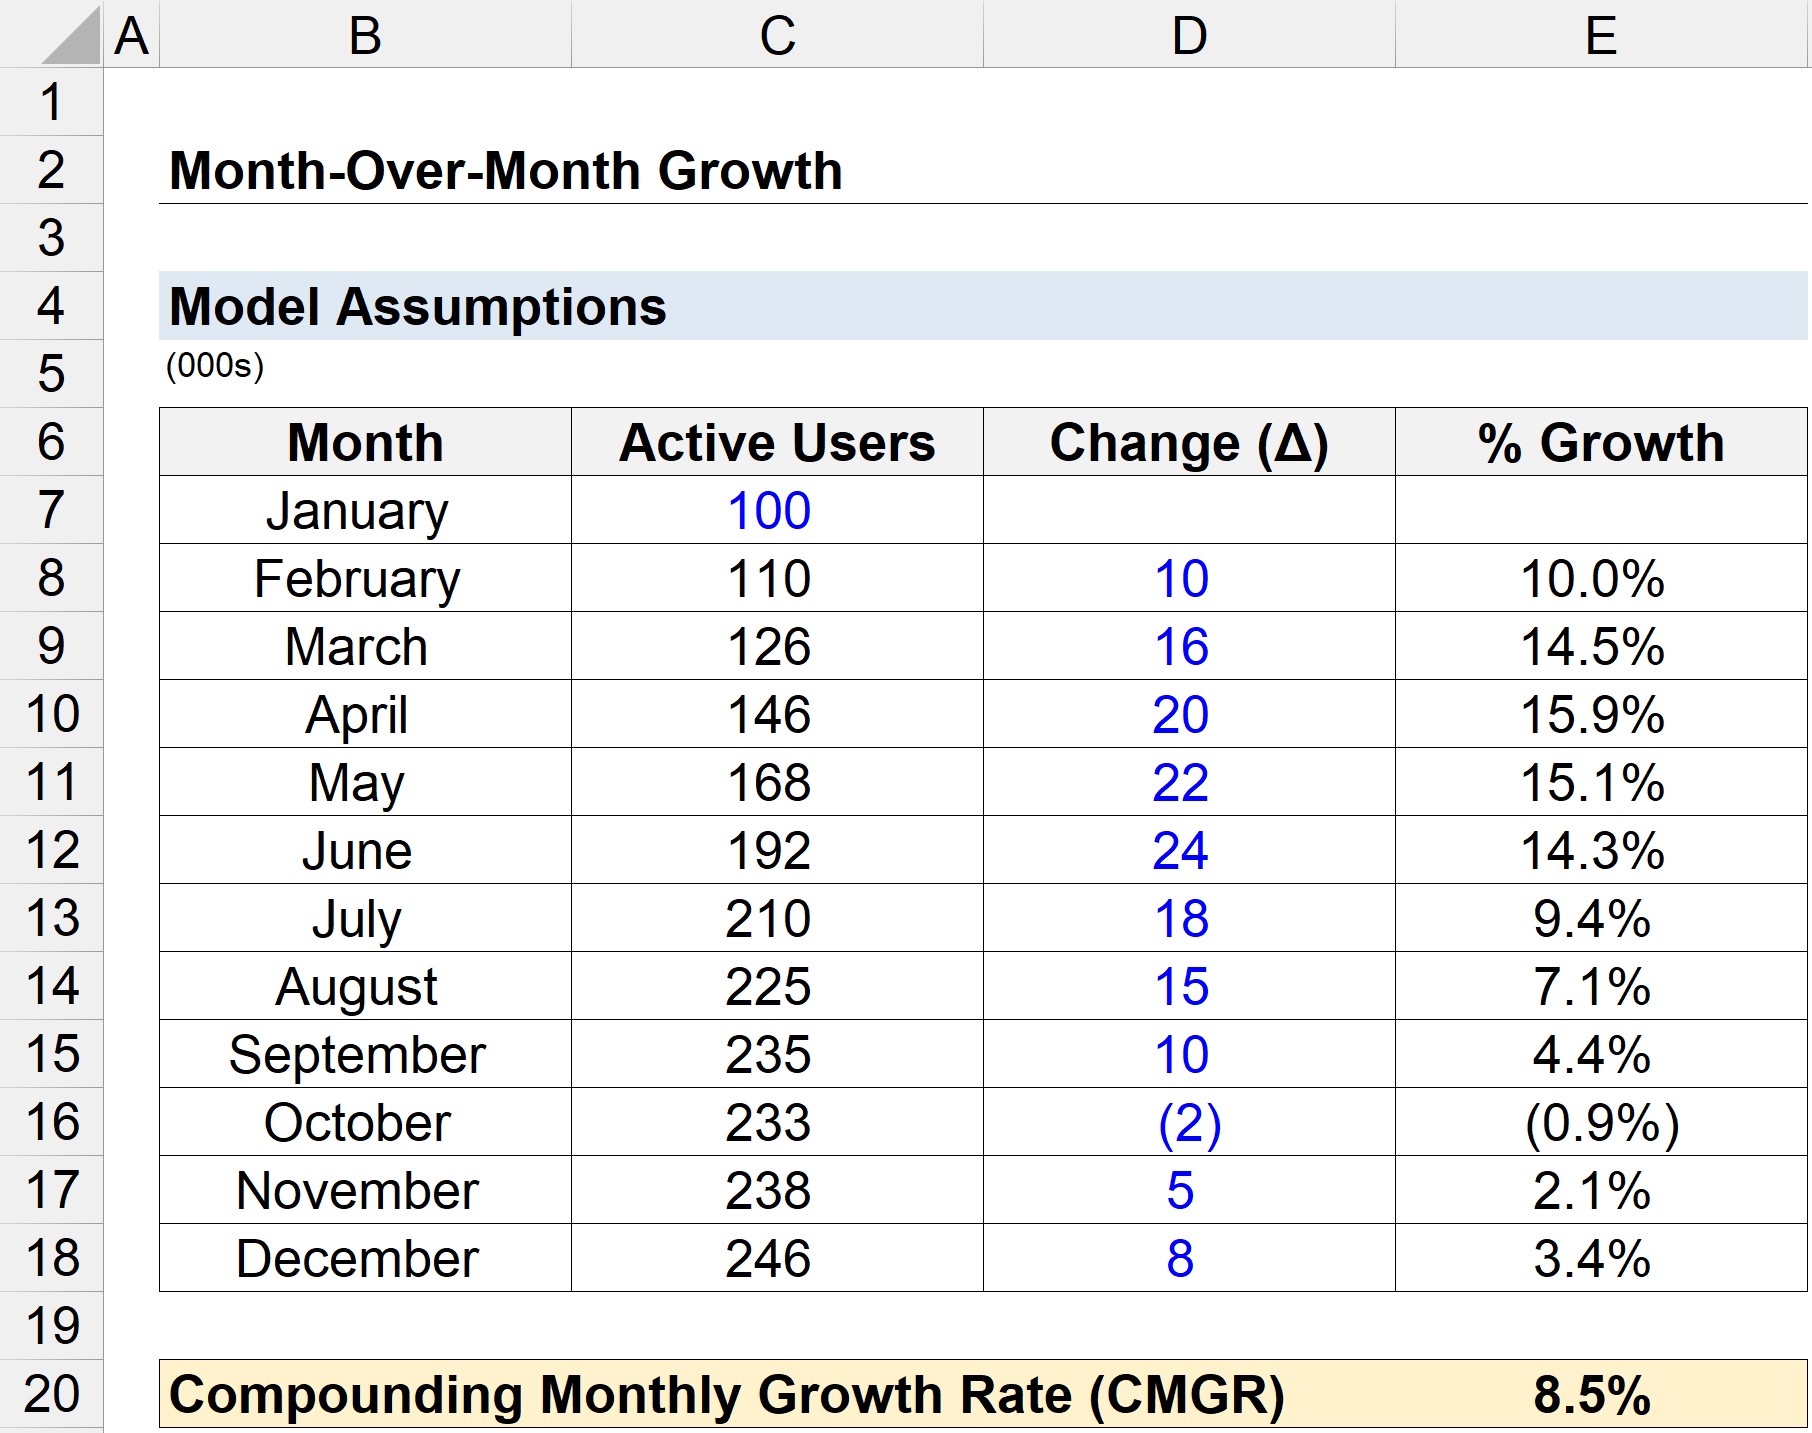
In January, the company had a total of 100k active users, with the net additions (and losses) in all the subsequent months summarized below.
- February = +10k
- March = +16k
- April = +20k
- May = +22k
- June = +24k
- July = +18k
- August = +15k
- September = +10k
- October = –2k
- November = +5k
- December = +8k
Starting from January, if we add the monthly change for each month, we arrive at the following active user counts.
| Month | Active Users | % M/M Growth |
|---|---|---|
| January | 100k | n.a. |
| February | 110k | 10.0% M/M |
| March | 126k | 14.5% M/M |
| April | 146k | 15.9% M/M |
| May | 168k | 15.1% M/M |
| June | 192k | 14.3% M/M |
| July | 210k | 9.4% M/M |
| August | 225k | 7.1% M/M |
| September | 235k | 4.4% M/M |
| October | 233k | (0.9%) M/M |
| November | 238k | 2.1% M/M |
| December | 246k | 3.4% M/M |
Moreover, we can divide the current month by the prior month and then subtract one to arrive at the month-over-month growth rates, as shown above in the far right column.
We can conclude that the company experienced the strongest growth around the Spring during March to June, with growth beginning to decline in the Fall.
Next, the compound monthly growth rate (CMGR) can be calculated using the equation shown below.
- Compound Monthly Growth Rate (CMGR) = (246k ÷ 100k)^(1 ÷ 11) – 1
- CMGR = 8.5%
On average, the Company’s user count grew by 8.5% per month between January and December.