What is Invested Capital?
Invested Capital (IC) refers to the financing raised by a company from debt and equity capital providers to fund its operations, such as its working capital requirements and purchase of fixed assets (PP&E), or capital expenditures (Capex).
How to Calculate Invested Capital (IC)
Invested capital (IC) is defined as the total funding contributed by equity and debt investors, which the company must strategically allocate to create economic value.
Invested capital can be considered either the net operating assets belonging to a company or the sources of funding (e.g. debt and equity) to finance its operations.
The former, termed the “Operating Approach”, is more common in practice and is a more convenient method than the latter, termed the “Financing Approach” – albeit the two methods should yield equivalent (or only marginally different) values.
- Equity Capital → From the perspective of equity shareholders, the rationale for providing capital to a company and holding shares in a company, which represents partial ownership in the company’s equity, is to benefit from shareholder value creation. Most often, a higher share price reflects value creation in the open markets, at which the investor can liquidate their holdings to realize a profit. The issuer of the equity can also compensate shareholders via the distribution of dividends (or stock buybacks – which can cause its share price to rise).
- Debt Capital → On the other hand, debt lenders provide capital to receive a yield on the financing arrangement that meets their target return. Unlike equity, the return on a traditional debt investment, such as a loan from a bank, is capped and predicated on the interest rate stated on the lending agreement, the structure of the financing (i.e. fixed vs. floating interest rate pricing), and the receipt of the original principal in full at maturity.
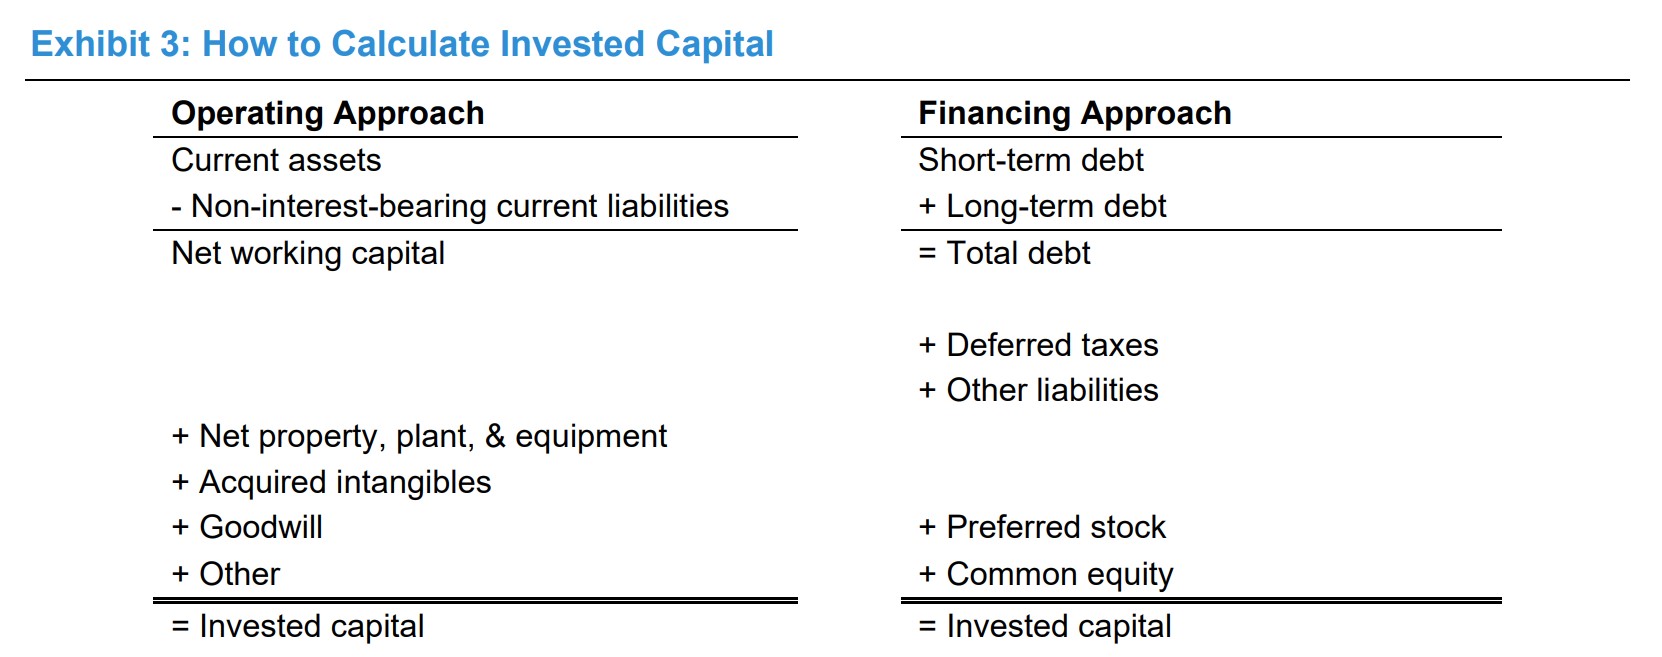
How to Calculate Invested Capital (Source: Morgan Stanley – Counterpoint Global)
The Wharton Online & Wall Street Prep Applied Value Investing Certificate Program
Learn how institutional investors identify high-potential undervalued stocks. Enrollment is open for the upcoming cohort.
Enroll TodayInvested Capital Formula
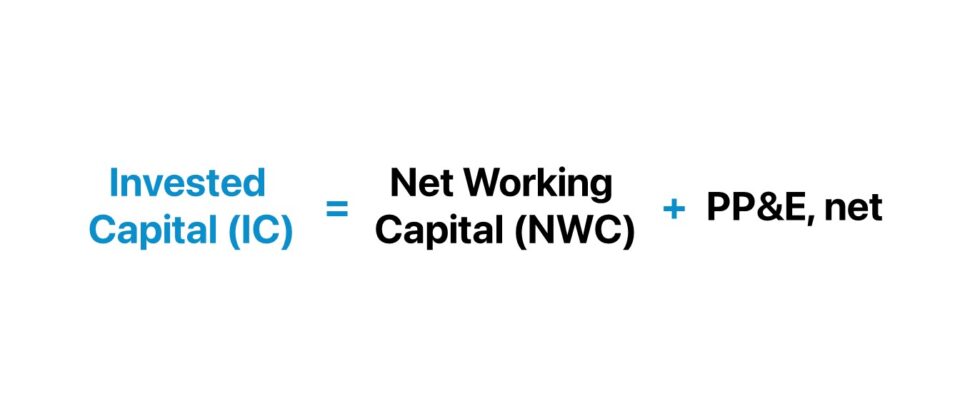
The formula to calculate invested capital (IC) under the operating approach is as follows.
Where:
- Net Working Capital (NWC) = Current Operating Assets – Current Operating Liabilities
- Ending PP&E, net = Beginning PP&E + Capital Expenditures (Capex) – Depreciation
Cash and cash equivalents are excluded from net working capital (NWC) because those non-operating assets are not part of a company’s core operating activities that are necessary for a company’s operations to run.
However, current operating assets can exclude cash entirely or include the minimum cash balance required for a company’s operations to continue running in the normal course (e.g. 2.0% of revenue).
In contrast, debt and interest-bearing securities are removed, since those items fall under the category of financing activities.
Other potential items to add include the value of acquired intangible assets and goodwill – which are line items recognized post-M&A – as well as other long-term assets.
The expanded invested capital formula, inclusive of intangible assets, is as follows.
Goodwill stems from M&A transactions, where the purchase price exceeds the fair value of the acquired assets, i.e. the premium above the fair market value (FMV).
With that said, the one shortcoming to the invested capital metric pertains to intangible assets, or more specifically, the intangibles belonging to a company (i.e. non-acquired) that are not recognized on the balance sheet.
In particular, the aforementioned pitfall is most applicable to companies that operate in intangible-intensive industries, where neglecting intangible assets – the core drivers of economic value and growth – is a material matter.
Hence, one workaround is to capitalize intangible investments – i.e. research and development (R&D) expense – which consists of estimating the annual change in net capitalized intangible assets.
The formula to calculate invested capital (IC) under the financing approach is as follows.
- Total Debt → The total debt component includes interest-bearing liabilities – short-term and long-term – such as commercial paper.
- Total Equity → The equity component comprises shareholders’ equity, preferred stock, and equity equivalents – which refer to long-term liabilities such as deferred taxes and deferred revenue.
Note: The subjective adjustments and treatment of certain line items are influential on the computed metric. Therefore, understanding each adjustment applied, its implications, and consistency across comparisons is critical for the invested capital (and ROIC) metric to be practical and meaningful.
How to Analyze Invested Capital in ROIC
The invested capital (IC) is computed, namely because it is the denominator in the return on invested capital (ROIC) metric, a fundamental measure of the operating efficiency at which companies operate.
The formula to calculate the return on invested capital (ROIC) metric is as follows.
Where:
- NOPAT = EBIT × (1 – Tax Rate)
ROIC vs. WACC – General Rules of Thumb
- ROIC > WACC → If a company’s return on invested capital (ROIC) exceeds its cost of capital (WACC), the outcome is value creation.
- ROIC < WACC → If a company’s return on invested capital (ROIC) is less than its cost of capital (WACC), the outcome is value destruction.
The higher the ROIC of a company, the higher the return generated per dollar of capital invested by equity and debt providers.
The ROIC is the standard benchmark for comparing operating performance among industry peers.
If the ROIC of a company is consistently greater than its cost of capital – i.e. a positive spread between the ROIC and WACC if graphed – the company is far more likely to produce more profits relative to its comparable peers and establish a sustainable, long-term economic moat.
Hypothetically, if a company’s NOPAT increased, while its invested capital was to be held constant, its ROIC would rise – all else being equal.
Invested Capital Calculator
We’ll now move to a modeling exercise, which you can access by filling out the form below.
1. Net Working Capital (NWC) Calculation Example
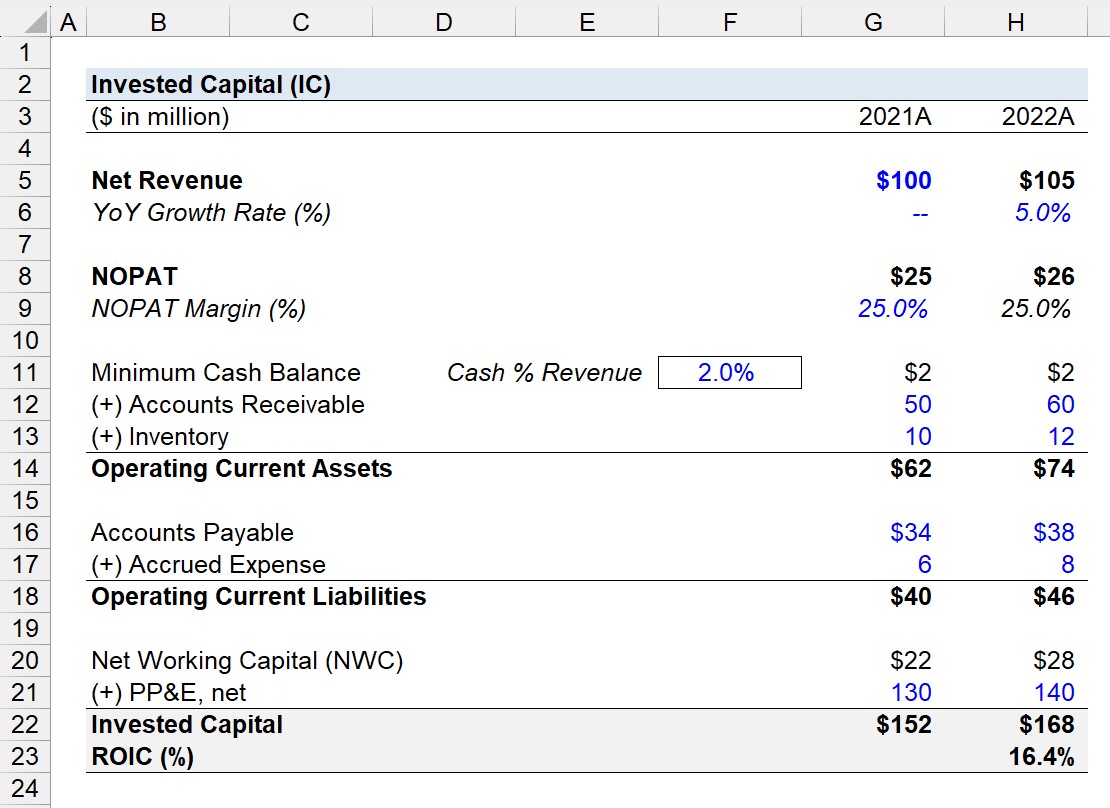
Suppose we’re tasked with calculating the invested capital (IC) of a company for the trailing two-year period (2021 to 2022).
In 2021, the company generated $100 million in net revenue, which grew by 5.0% in the subsequent year.
- Net Revenue, 2021A = $100 million
- Net Revenue, 2022A = $100 million × (1 + 5.0%) = $105
The NOPAT margin of the company remained constant at 25.0% in both periods.
- NOPAT Margin (%), 2021A and 2022A = 25.0%
By multiplying the NOPAT margin by the net revenue in the corresponding year, we can solve for the company’s NOPAT.
- NOPAT, 2021A = $100 million × 25.0% = $25 million
- NOPAT, 2022A = $105 million × 25.0% = $26 million
The company’s minimum cash balance – i.e. the cash required on hand to fund day-to-day operating activities – is 2.0% of revenue.
- Minimum Cash Balance = $2.0% × $100 million = $2.0 million
- Minimum Cash Balance = $2.0% × $105 million = $2.1 million
The operating working capital line item balances are as follows.
Operating Current Assets
- Accounts Receivable, 2021A = $50 million
- Accounts Receivable, 2022A = $60 million
- Inventory, 2021A = $10 million
- Inventory, 2022A = $12 million
Operating Current Liabilities
- Accounts Payable, 2021A = $34 million
- Accounts Payable, 2022A = $38 million
- Accrued Expense, 2021A = $6 million
- Accrued Expense, 2022A = $8 million
In summation, the net working capital (NWC) of the company is $22 million and $28 million in 2021 and 2022, respectively.
- Net Working Capital (NWC), 2021A = $62 million – $40 million = $22 million
- Net Working Capital (NWC), 2022A = $74 million – $46 million = $28 million
2. Invested Capital Calculation Example
The ending PP&E balance, on the other hand, was $130 million and $140 million in the same two-year time frame.
Ending PP&E, net
- Net PP&E, 2021A = $130 million
- Net PP&E, 2021A = $140 million
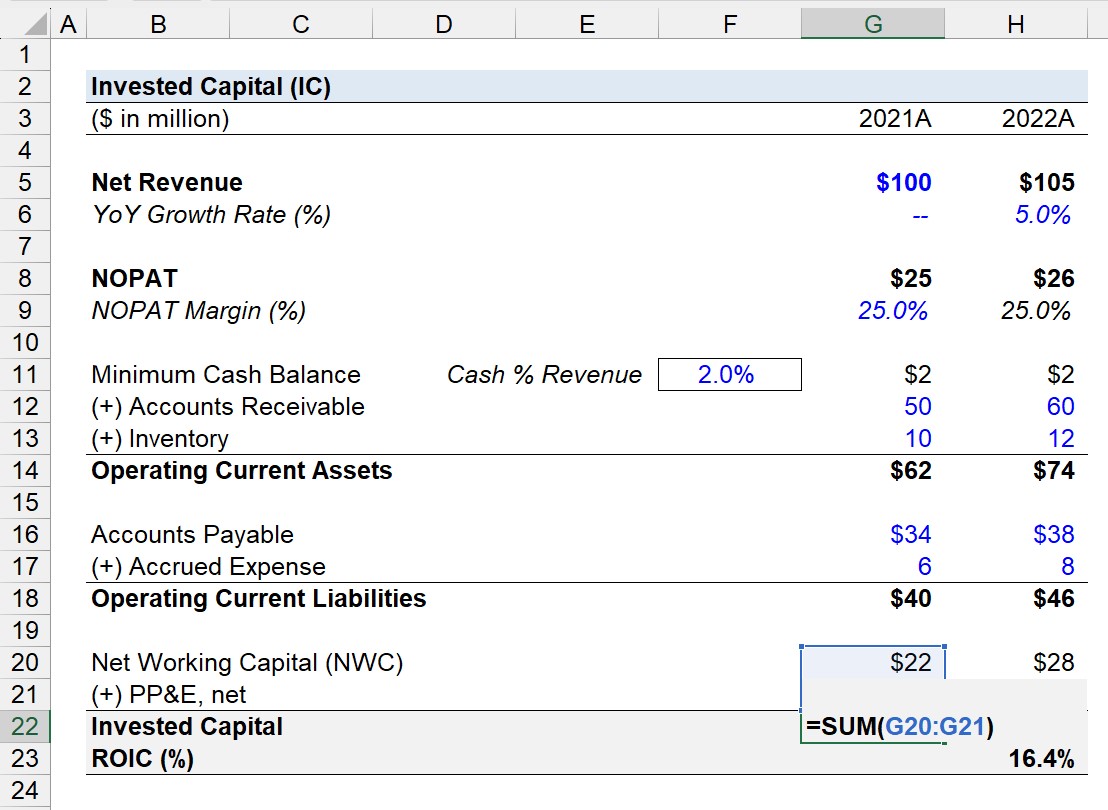
The sum of our company’s net working capital (NWC) and net PP&E is its invested capital for each year, which amounts to $152 million and then $168 million the subsequent year.
Invested Capital (IC)
- Invested Capital (IC), 2021A = $22 million + $130 million = $152 million
- Invested Capital (IC), 2022A = $28 million + $140 million = $168 million
3. Return on Invested Capital (ROIC) Calculation Example
In the next part of our exercise, we’ll compute the ROIC of our company using the figures determined in the prior section.
Starting off, we must calculate the average invested capital from 2021 to 2022, which is $160 million.
- Average Invested Capital (IC), 2021A to 2022A = ($152 million + $168 million) ÷ 2 = $160 million
The company generated $26 million in NOPAT over 2022, i.e. from the end of fiscal year 2021 to the end of 2022. Hence, the usage of the average invested capital (IC) balance to match the timing of the numerator and denominator.
In closing, our hypothetical company’s ROIC is 16.4%, which we arrived at by dividing its NOPAT by its average invested capital (IC).
- Return on Invested Capital (ROIC) = $26 million ÷ $160 million = 16.4%