 Skip to main content
What is NOPAT?
NOPAT, or Net Operating Profit After Tax, is a company’s theoretical after-tax operating income if it had no debt in its capital structure.
By removing the impact of financing differences in capital structures, comparisons between industry peers become more “apples to apples” – especially since discretionary decisions regarding leverage can significantly skew data sets.
How to Calculate NOPAT?
NOPAT is an abbreviation that stands for “Net Operating Profit After Tax”, and is a measure of profit that assumes that the company did NOT receive tax benefits from holding debt.
Among industry practitioners, as well as in academia, the metric is frequently used interchangeably with terms such as:
- “Tax-Effected” EBIT
- Earnings Before Interest After Taxes (EBIAT)
So how exactly is the tax rate “adjusted”?
Simply put, the metric represents a company’s operating profit after removing financing items like interest expense, which directly impacts the taxes paid via the “interest tax shield”.
NOPAT Formula
NOPAT represents the operating income available to all providers of capital (e.g. debt lenders, equity shareholders).
In particular, calculating the metric is a critical step in calculating a company’s available future free cash flows (FCFs), which serve as the foundation of the discounted cash flow analysis (DCF) method.
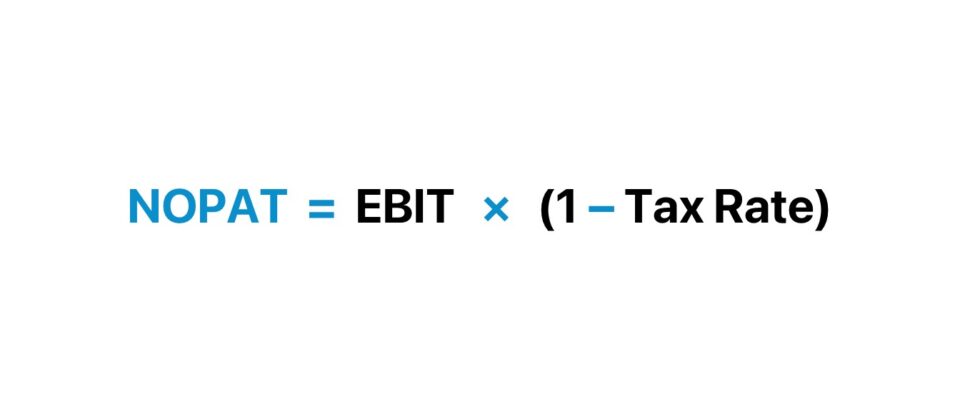
The calculation comprises multiplying EBIT by (1 – t), in which “t” refers to the target’s marginal tax rate.
EBIT equals the gross profit of a company minus the total operating expenses incurred in the given period.
The operating expenses (OpEx) section of the income statement frequently includes items such as depreciation, employee salaries, overhead, and rent.
While for purposes of modeling, the marginal tax rate can be used, the effective tax rate – the actual tax rate paid based on historical data – can also serve as a useful point of reference.
Another formula begins with net income and has a couple of additional steps to calculate the metric.
From net income (“bottom line”), we add back non-operating losses and deduct any non-operating gains, and then add back the impact of interest expense and taxes. In effect, we have gone from net income up to the operating income line item.
Just like the 1st formula, the next step is to multiply by (1 – Tax Rate).
Net income is a metric that accounts for the effects of non-core income / (losses), interest expense, and taxes, which is why we’re removing the impact of those line items from our calculation.
In theory, the metric should represent the core operating income (EBIT) of a company – taxed after removing the impact of non-operating gains / (losses), debt financing (e.g. “tax shield”), and taxes paid.
Thus, the net operating profit after tax is a company’s potential cash earnings if its capitalization were unleveraged — that is, if it had no debt, i.e. tax savings from existing debt are NOT included.
NOPAT Calculator
We’ll now move to a modeling exercise, which you can access by filling out the form below.
1. Income Statement Assumptions
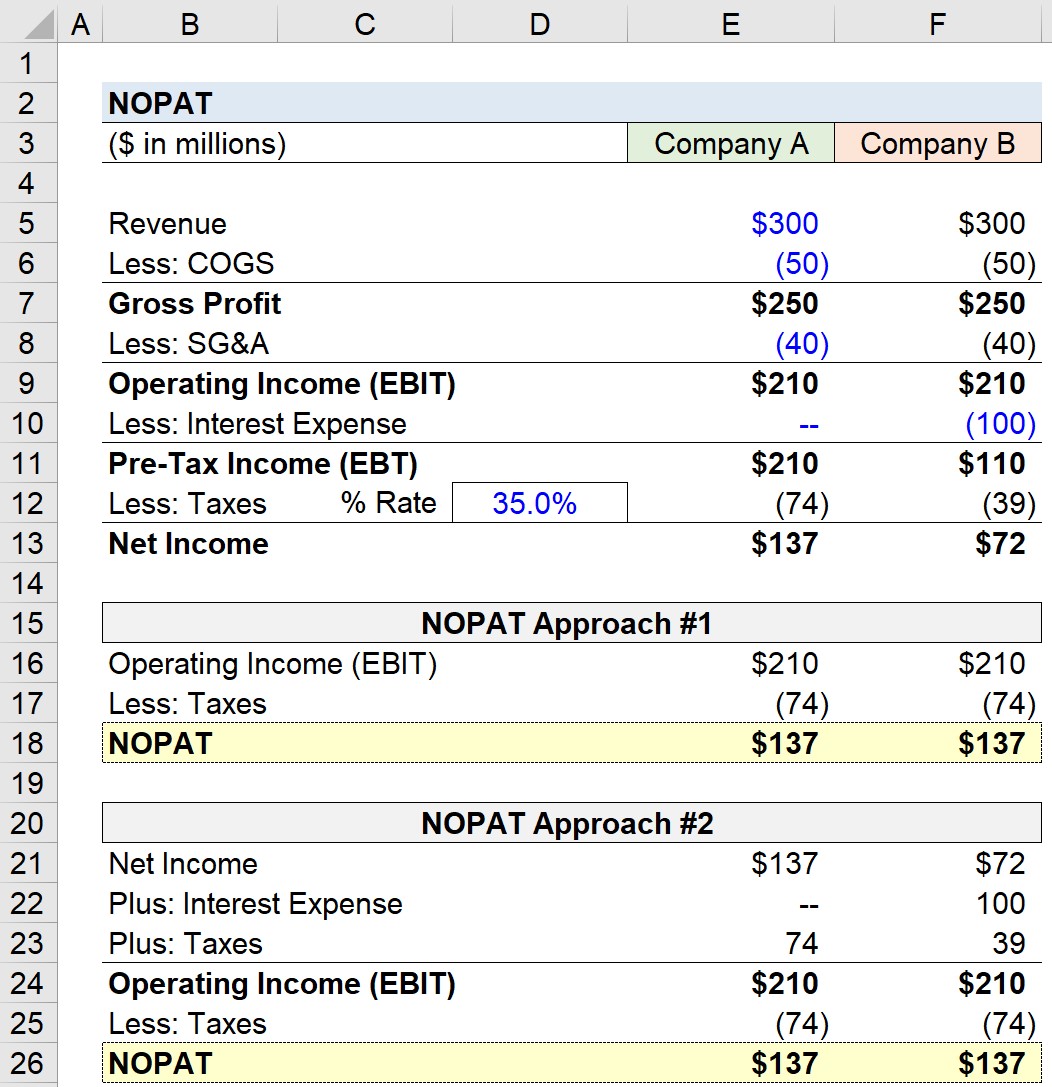
Suppose that we have the following two companies – Company A and Company B – which share the following financial data:
- Revenue = $300m
- Cost of Goods Sold (COGS) = $50m
- Selling, General & Administrative (SG&A) = $40m
Until we reach the operating income line, the two companies have identical financials and profit margins.
- Gross Profit = $250m
- Operating Profit = $210m
2. Capital Structure Analysis
The financials of our hypothetical companies begin to diverge because of a non-operating expense, interest expense.
Further, the interest expense incurred is a function of each company’s capital structure (i.e. the debt-to-equity mix).
While Company A is an all-equity financed company with zero interest expense, Company B has incurred $100m of interest expense, which reduces its taxable income since interest is tax-deductible.
At the pre-tax income line (EBT), we see the following divergence:
- EBT, Company A = $210m
- EBT, Company B = $110m
The source of the $100m difference is the interest expense mentioned earlier – furthermore, the taxes of the two companies vary significantly because of the tax savings associated with interest (i.e. the “interest tax shield”).
At a 35% tax rate, the companies pay the following taxes:
- Taxes Paid, Company A = $74m
- Taxes Paid, Company B = $39m
Here, Company B has benefited from $35m in tax savings ($74m – $39m).
3. NOPAT Calculation Analysis
Conceptually, we know our end goal is to net out the impact of estimated taxes from operating income (EBIT).
In the first approach, the calculation is straightforward, as we just multiply EBIT by (1 – Tax Rate).
If we input the relevant data points into our NOPAT formula, we get the following equation:
- NOPAT = $210m × (1 – 35%) = $137m
Note that despite the fact that Company B benefited from the interest tax shield, the value for both companies is equivalent.
4. NOPAT Calculation Example
In the second approach, we’ll calculate NOPAT starting from net income.
We need to work our way from net income to EBIT, before repeating the same process as the first approach.
- EBIT, Company A = $137m Net Income + $0m Interest Expense + $74m Taxes = $210m
- EBIT, Company B = $72m Net Income + $100m Interest Expense + $39m Taxes = $210m
So for both companies, EBIT comes out to $210m, and the subsequent step is the following:
- NOPAT = $210m EBIT × (1 – 35% Tax Rate) = $137m
To reiterate from earlier, the impact of debt financing is ignored – more specifically, the interest tax shield is removed.
In closing, we can confirm that under both methods, the NOPAT comes out to $137m – which shows the capital-structure neutrality of the metric.

Everything You Need To Master Financial Modeling
Enroll in The Premium Package: Learn Financial Statement Modeling, DCF, M&A, LBO and Comps. The same training program used at top investment banks.
Enroll Today
")


