
- What is the Valuation of NVIDIA?
- NVIDIA Valuation Model Introduction
- NVIDIA DCF Valuation Model
- Inputting Historical Data of NVIDIA
- Forecasting the Income Statement
- Non-GAAP Reconciliation
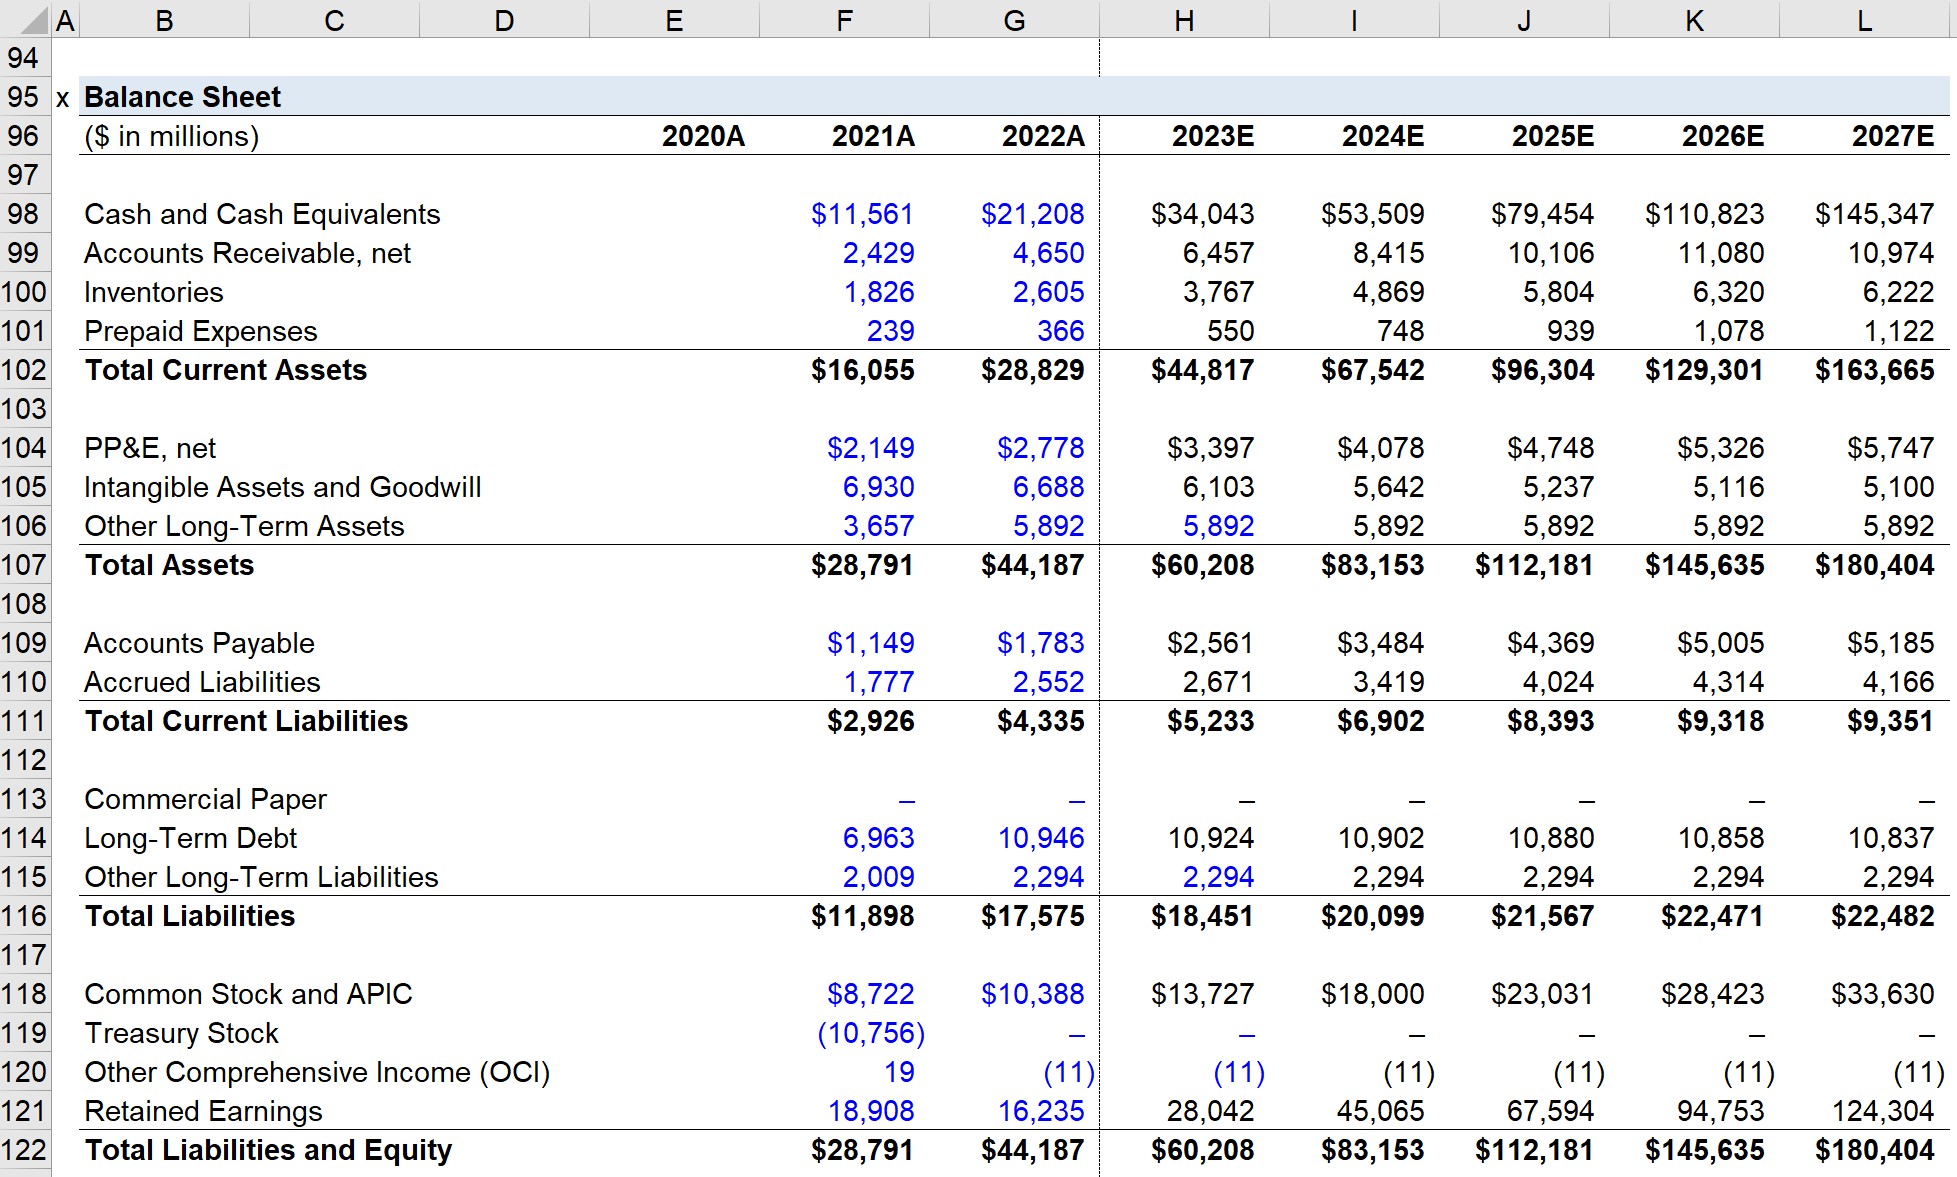
- NVIDIA Balance Sheet Forecast
- Forecasting the Cash Flow Statement
- NVIDIA Debt Schedule
- NVIDIA Free Cash Flow Build (FCF)
- NVIDIA WACC Calculation
- NVIDIA DCF Valuation Analysis
- DCF Implied Share Price Calculation
What is the Valuation of NVIDIA?
In the following post, we’ll build a DCF valuation model for NVIDIA (NASDAQ: NVDA) to determine its intrinsic value and implied share price.
NVIDIA, a pioneer in graphics processing units (GPUs), has become a platform specializing in various disruptive technologies, such as data center computing, visualization and automotive technologies.
NVIDIA Valuation Model Introduction
The first step to create a DCF model for NVIDIA — or any company — is to develop an understanding of the company, its business model and the industry dynamics.
NVIDIA’s 10-K, its mandatory annual filing with the SEC, provides not only the core financial statements, but also details regarding its different business segments, the external risks that could affect future performance, the prevailing competitive landscape, and so forth.
Click on the hyperlink below to view NVIDIA’s 10-K filed for the fiscal year ending January 30, 2022.
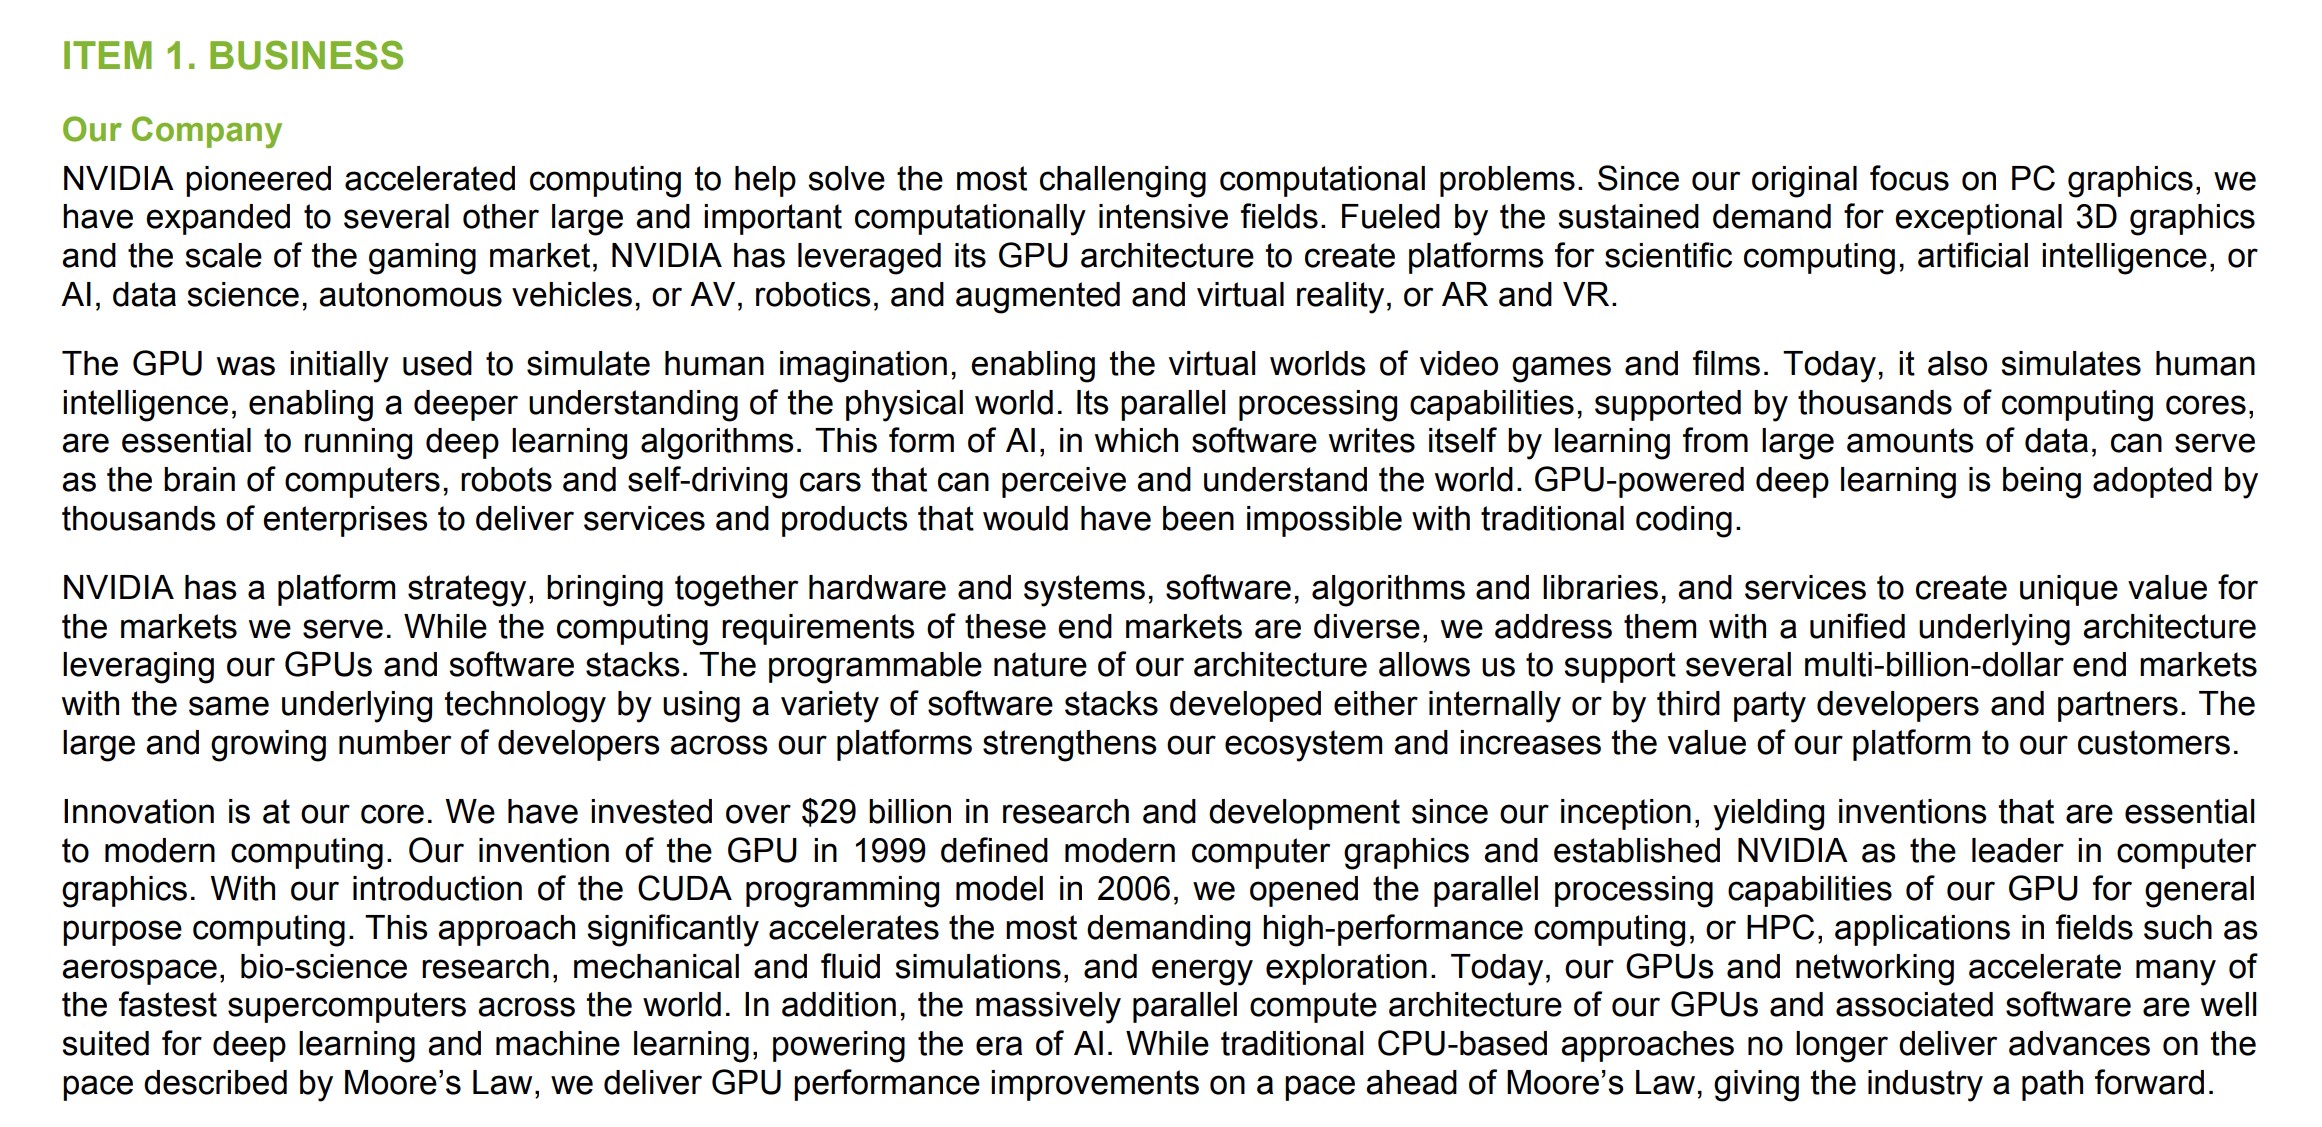
NVIDIA Business Model Overview
For a brief overview of NVIDIA’s business model, see the screenshot below as pulled from its 10-K:
NVIDIA DCF Valuation Model
We’ll now move to a modeling exercise, which you can access by filling out the form below.
Disclaimer
Before we begin, we’d like to emphasize the fact that our DCF for NVIDIA is meant purely for educational purposes, and not intended to serve as financial or investment advice of any sort.
Further, our model’s assumptions are not backed by hours of research or in-depth analysis since our focus is primarily on teaching the mechanics of building a DCF model.
We thus recommend further refining our model’s assumptions, rather than solely using our simplified approach that relies on equity research reports and consensus estimates.
Inputting Historical Data of NVIDIA
We’ll start by entering some basic details regarding NVIDIA at the top of our model, such as the current share price, the latest closing date, and the currency units of our model.
- Current Share Price = $168.98
- Latest Closing Date = 05/23/22
- Units = $ in millions
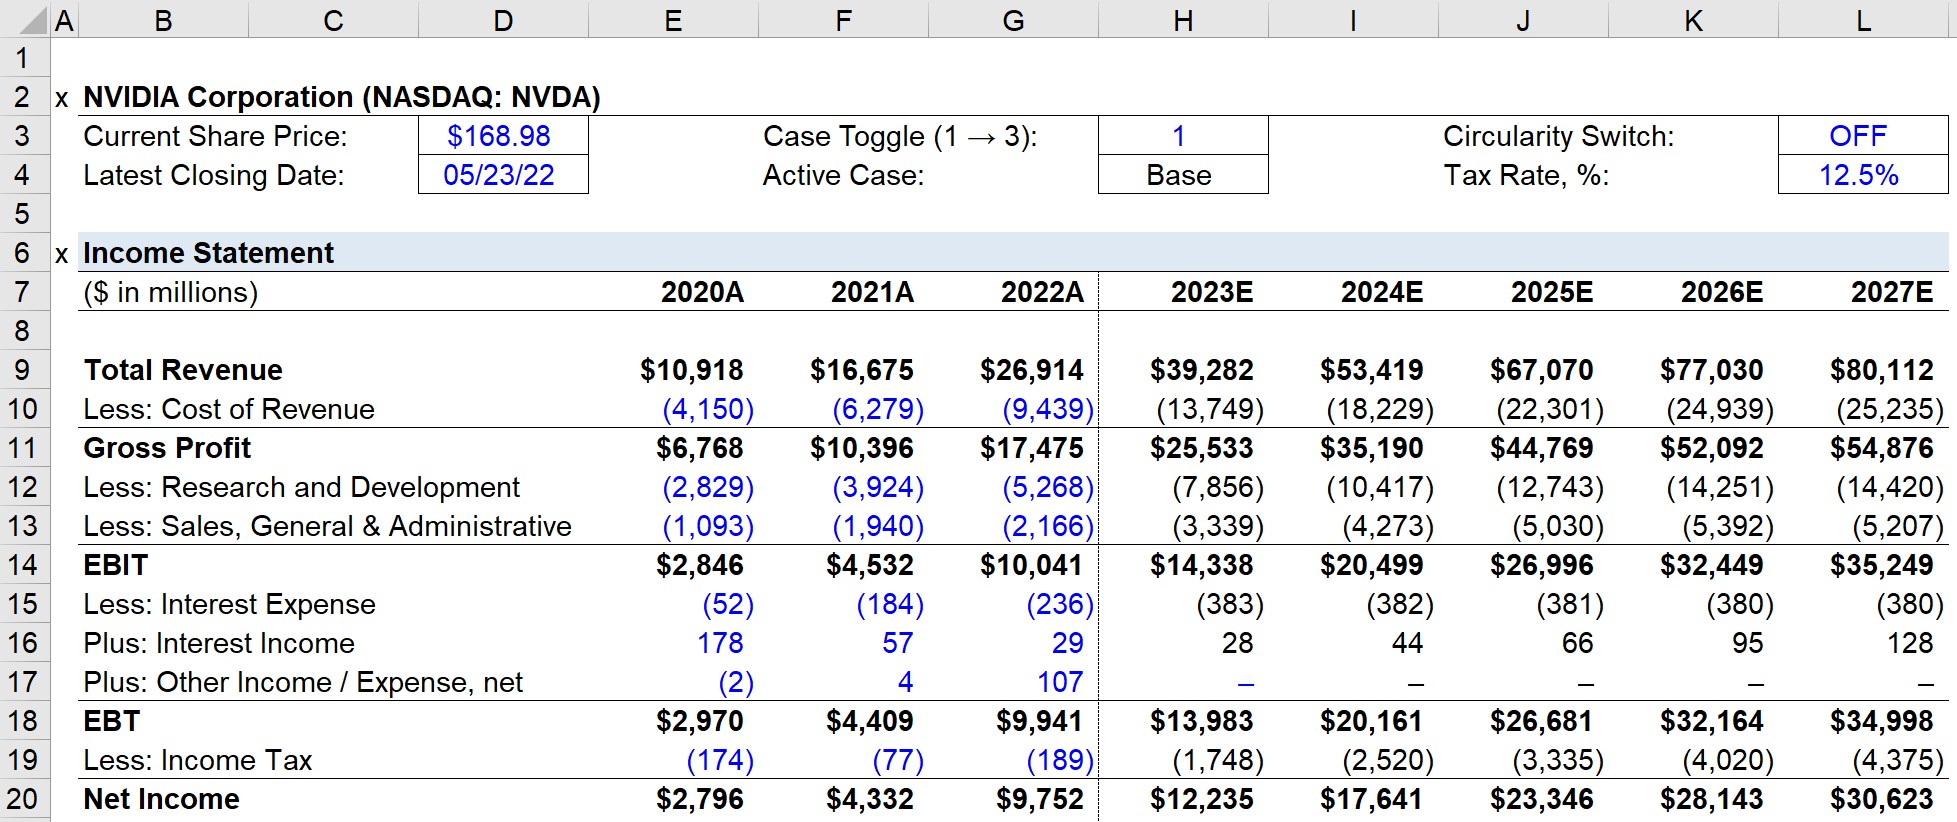
Next, the layout of our model is set up, where we’ll enter three years of income statement data and two years of balance sheet data.
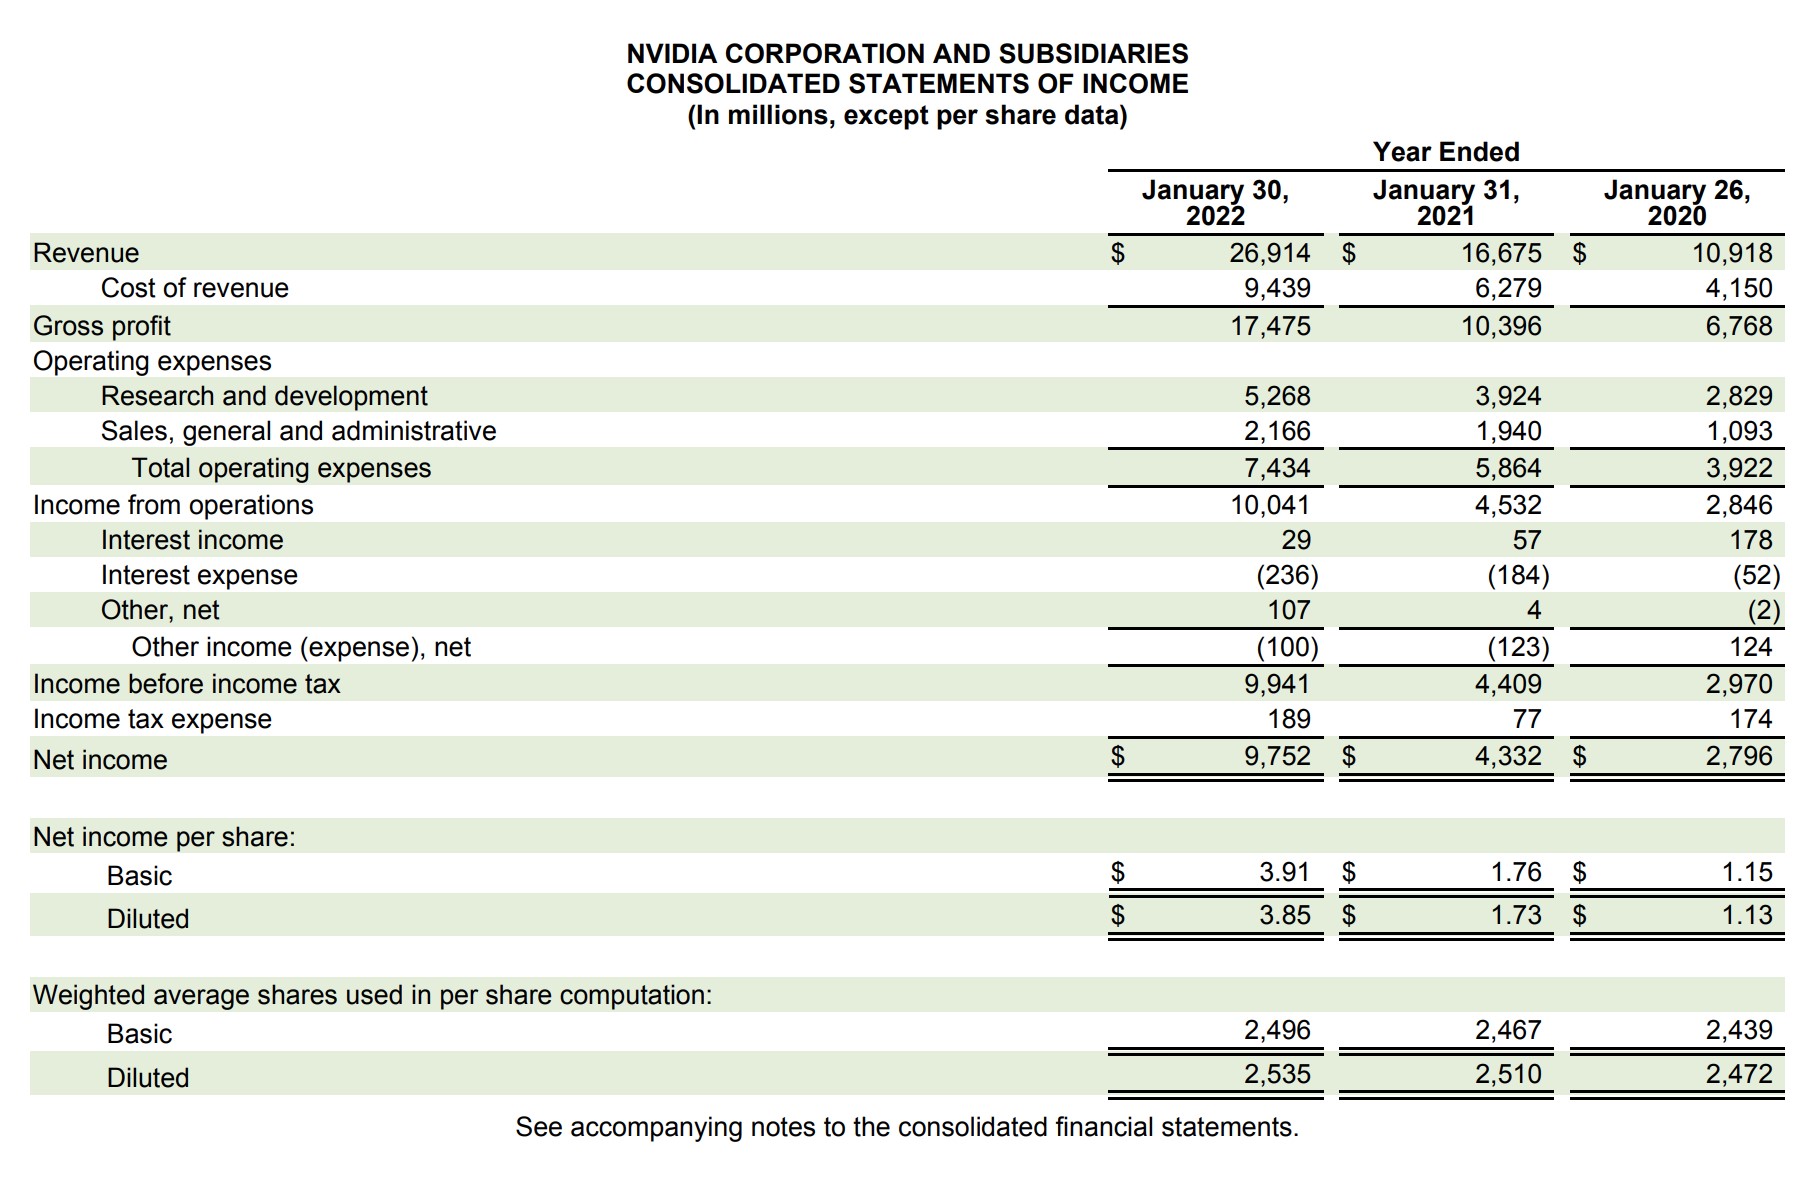
Historical Income Statement
Starting with revenue (i.e. the “top-line”), NVIDIA’s total revenue has grown by 52.7% and 61.4% year-over-year (YoY) for fiscal years ending 2021 and 2022, respectively.
With regard to its gross margins, NVIDIA has proven to be a profitable company in the last couple of years, exhibiting a gross margin consistently above 60%.
Compared to SG&A, a significant amount of spending is allocated to research and development, which is expected because of NVIDIA’s need for continuous reinvestment in product development and design.
Interestingly, NVIDIA has an operating margin under GAAP reporting standards that exceeds 20% (and even higher after adjusting for stock-based compensation) — yet the effective tax rate of NVIDIA came in at only 1.9% and 1.7% for the prior two years.
The completed income statement forecast that we’re working toward is shown below:
Historical Balance Sheet
For NVIDIA’s balance sheet, we’ll consolidate line certain line items that are driven by the same assumptions.
For instance, marketable securities are added to cash and cash equivalents.
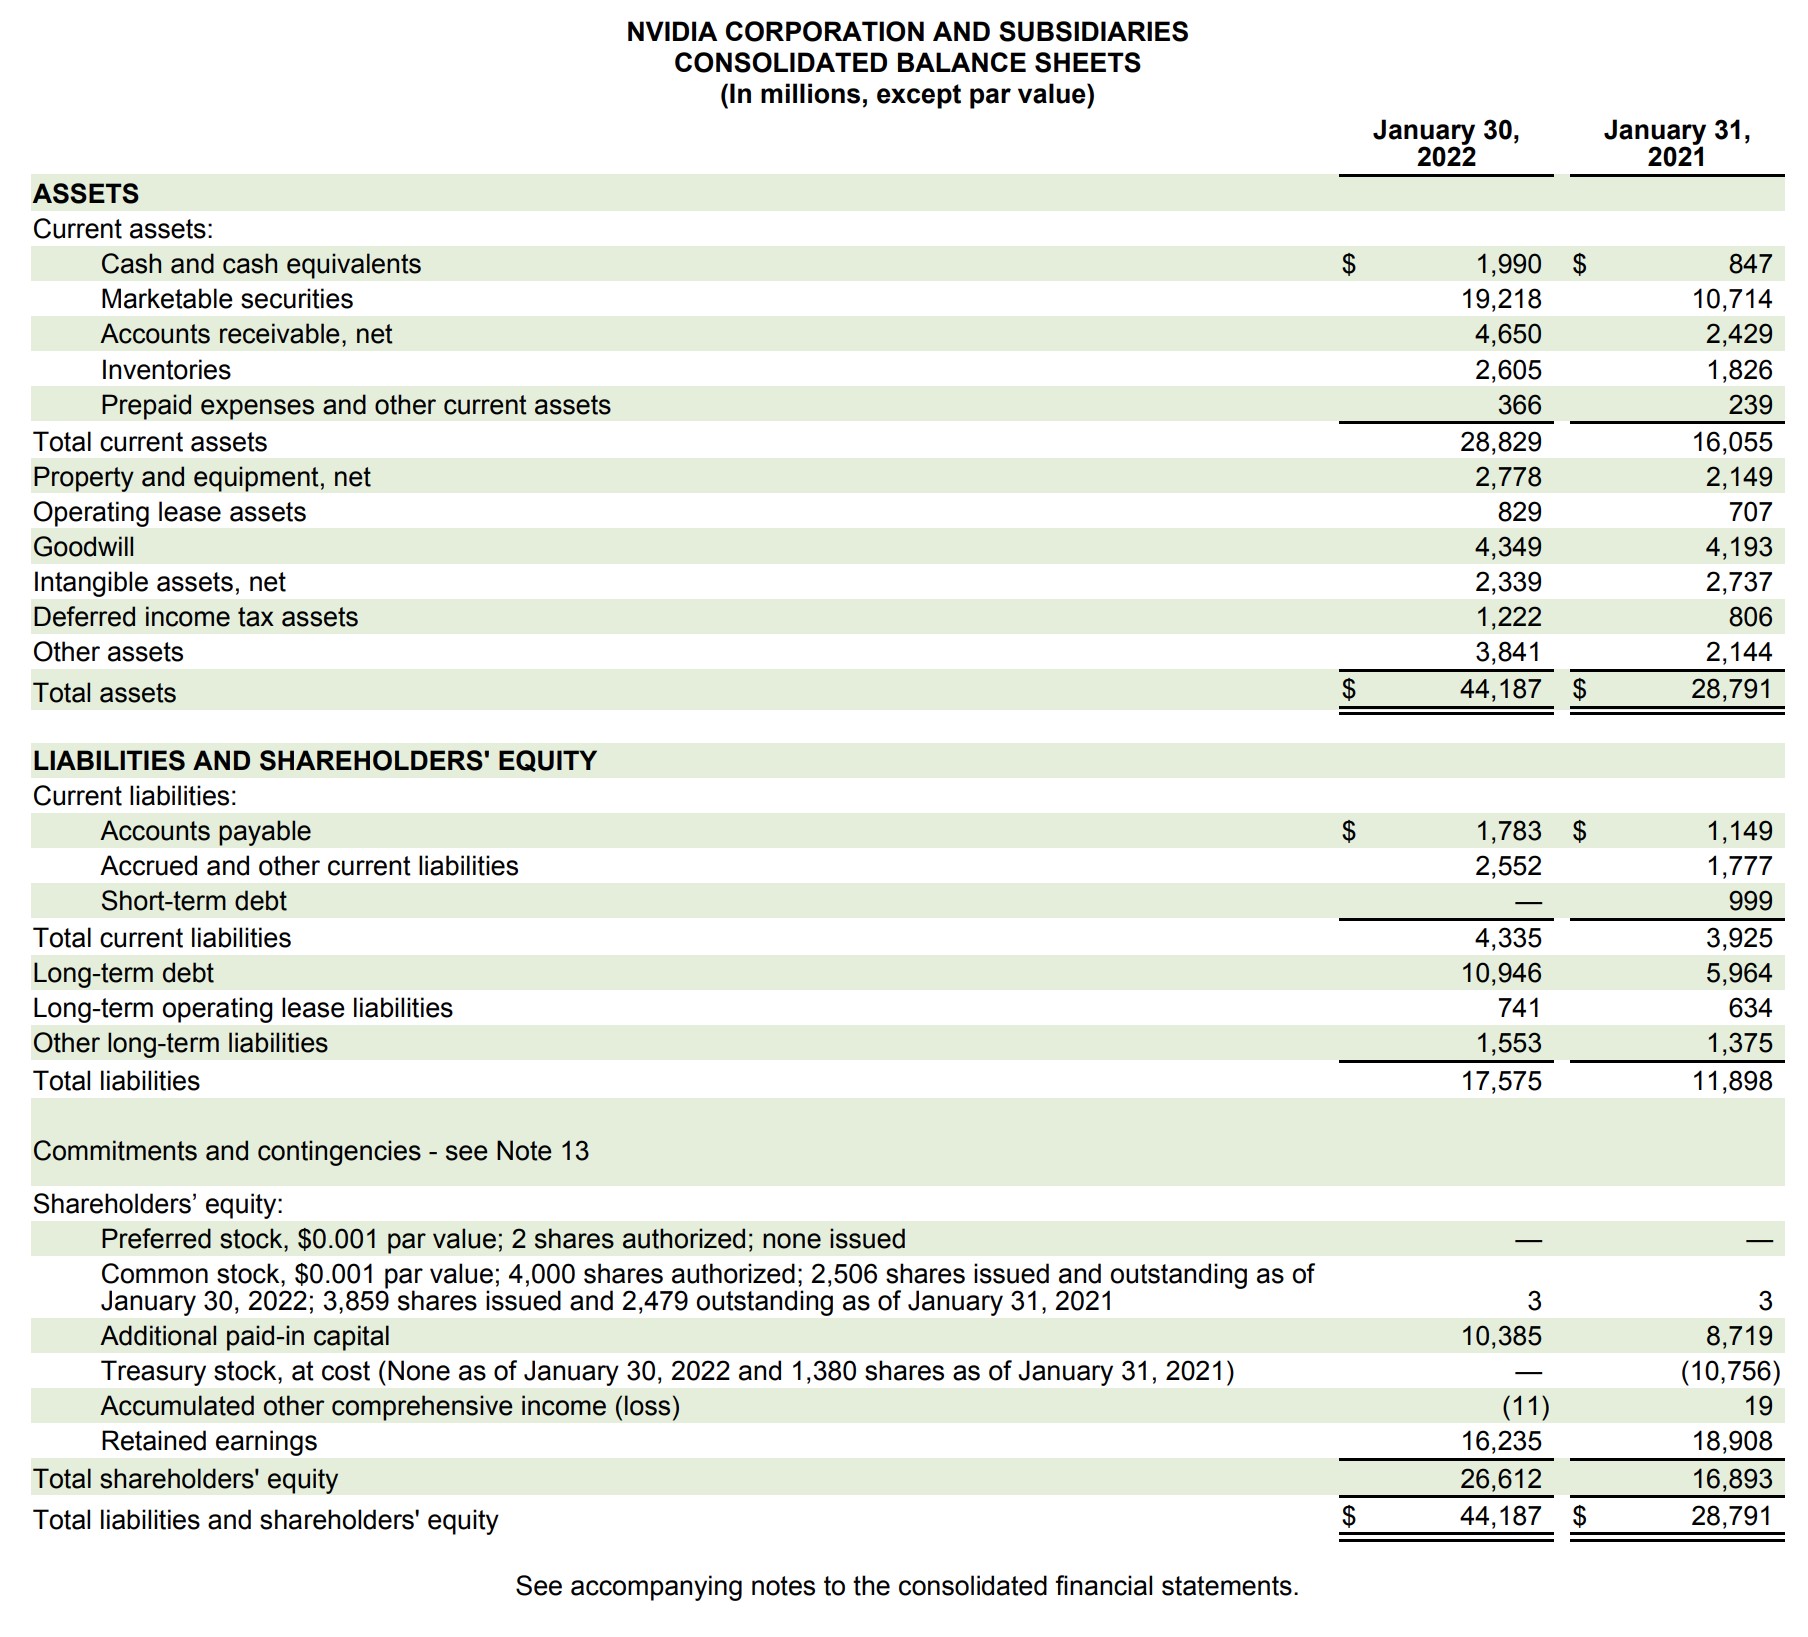
The balance sheet forecast that we’ll soon complete is shown below:
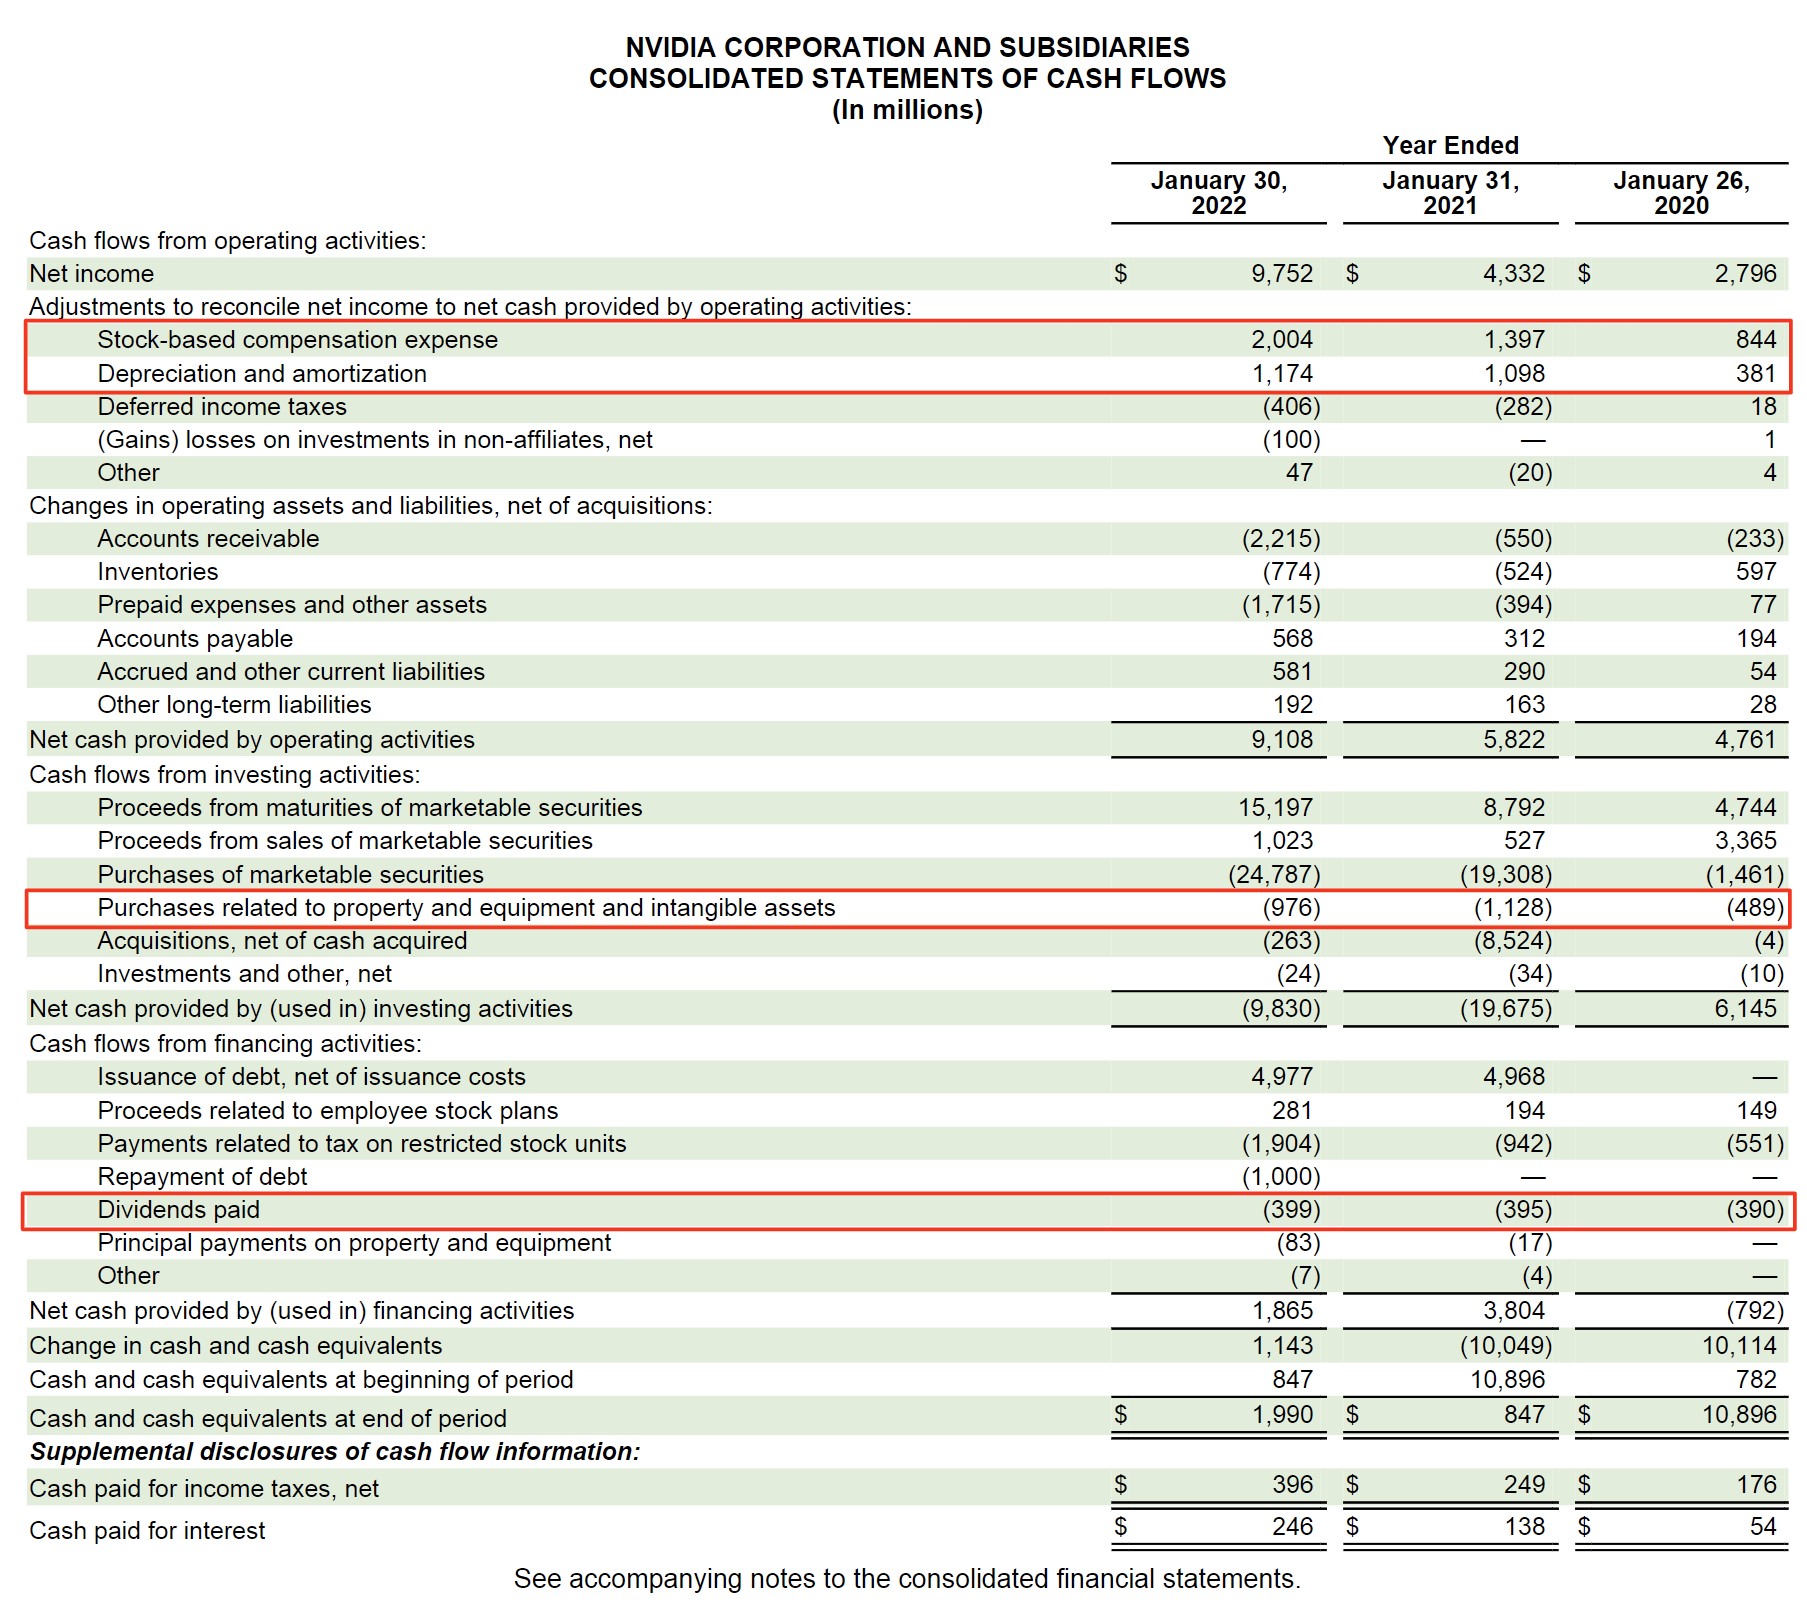
Historical Cash Flow Statement
Unlike the income statement and balance sheet, the historical cash flow statement does not need to be entered into a model.
However, there are a couple of important line items to make note of, such as stock-based compensation, D&A, capital expenditures, and shareholder dividend payments.
Forecasting the Income Statement
Revenue Growth Analysis
The revenue forecast is arguably the most important part of a financial model since multiple income statement and balance sheet line items are projected using revenue, either directly or indirectly.
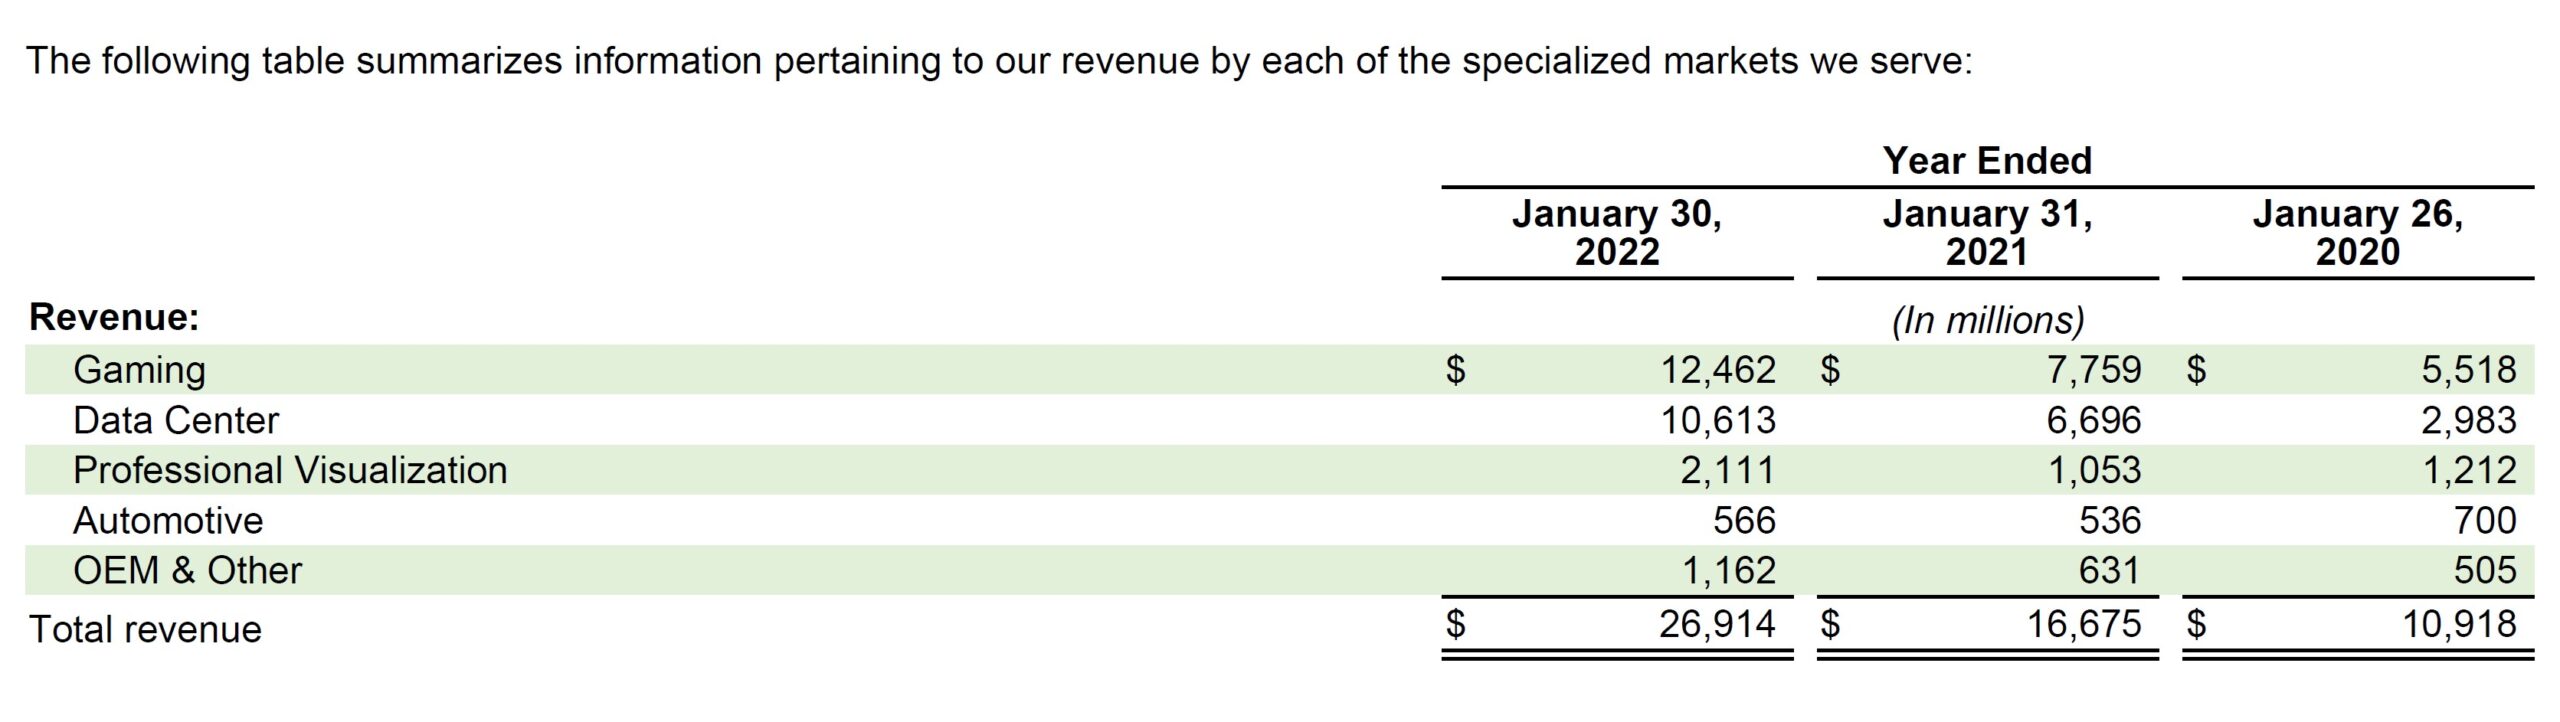
The process of projecting NVIDIA’s revenue will consist of first entering the historical revenue per segment, in which there are five different end markets.
After calculating the Y/Y growth rate for each, the projected revenue will be equal to the prior year’s revenue multiplied by one plus the growth rate assumption.
Based on historical trends and NVIDIA’s fastest (or slowest) growing segments, we’ll make assumptions around how its revenue will grow in 2023.
Then, for the final year, we’ll make a simplified assumption of making the growth rate equal to 4.0% each year.
The rationale behind the 4.0% growth rate is that for most companies, revenue growth eventually slows down to match the GDP growth rate, which we’re assuming is the case here.
For the years in between, we’ll subtract the 2023 growth rate by the 2027 growth rate, and then divide it by the number of years (i.e. 4 years) in between to “smooth” out the growth rate.
The calculated rate is then subtracted from the prior year for all the years between 2023 and 2027.
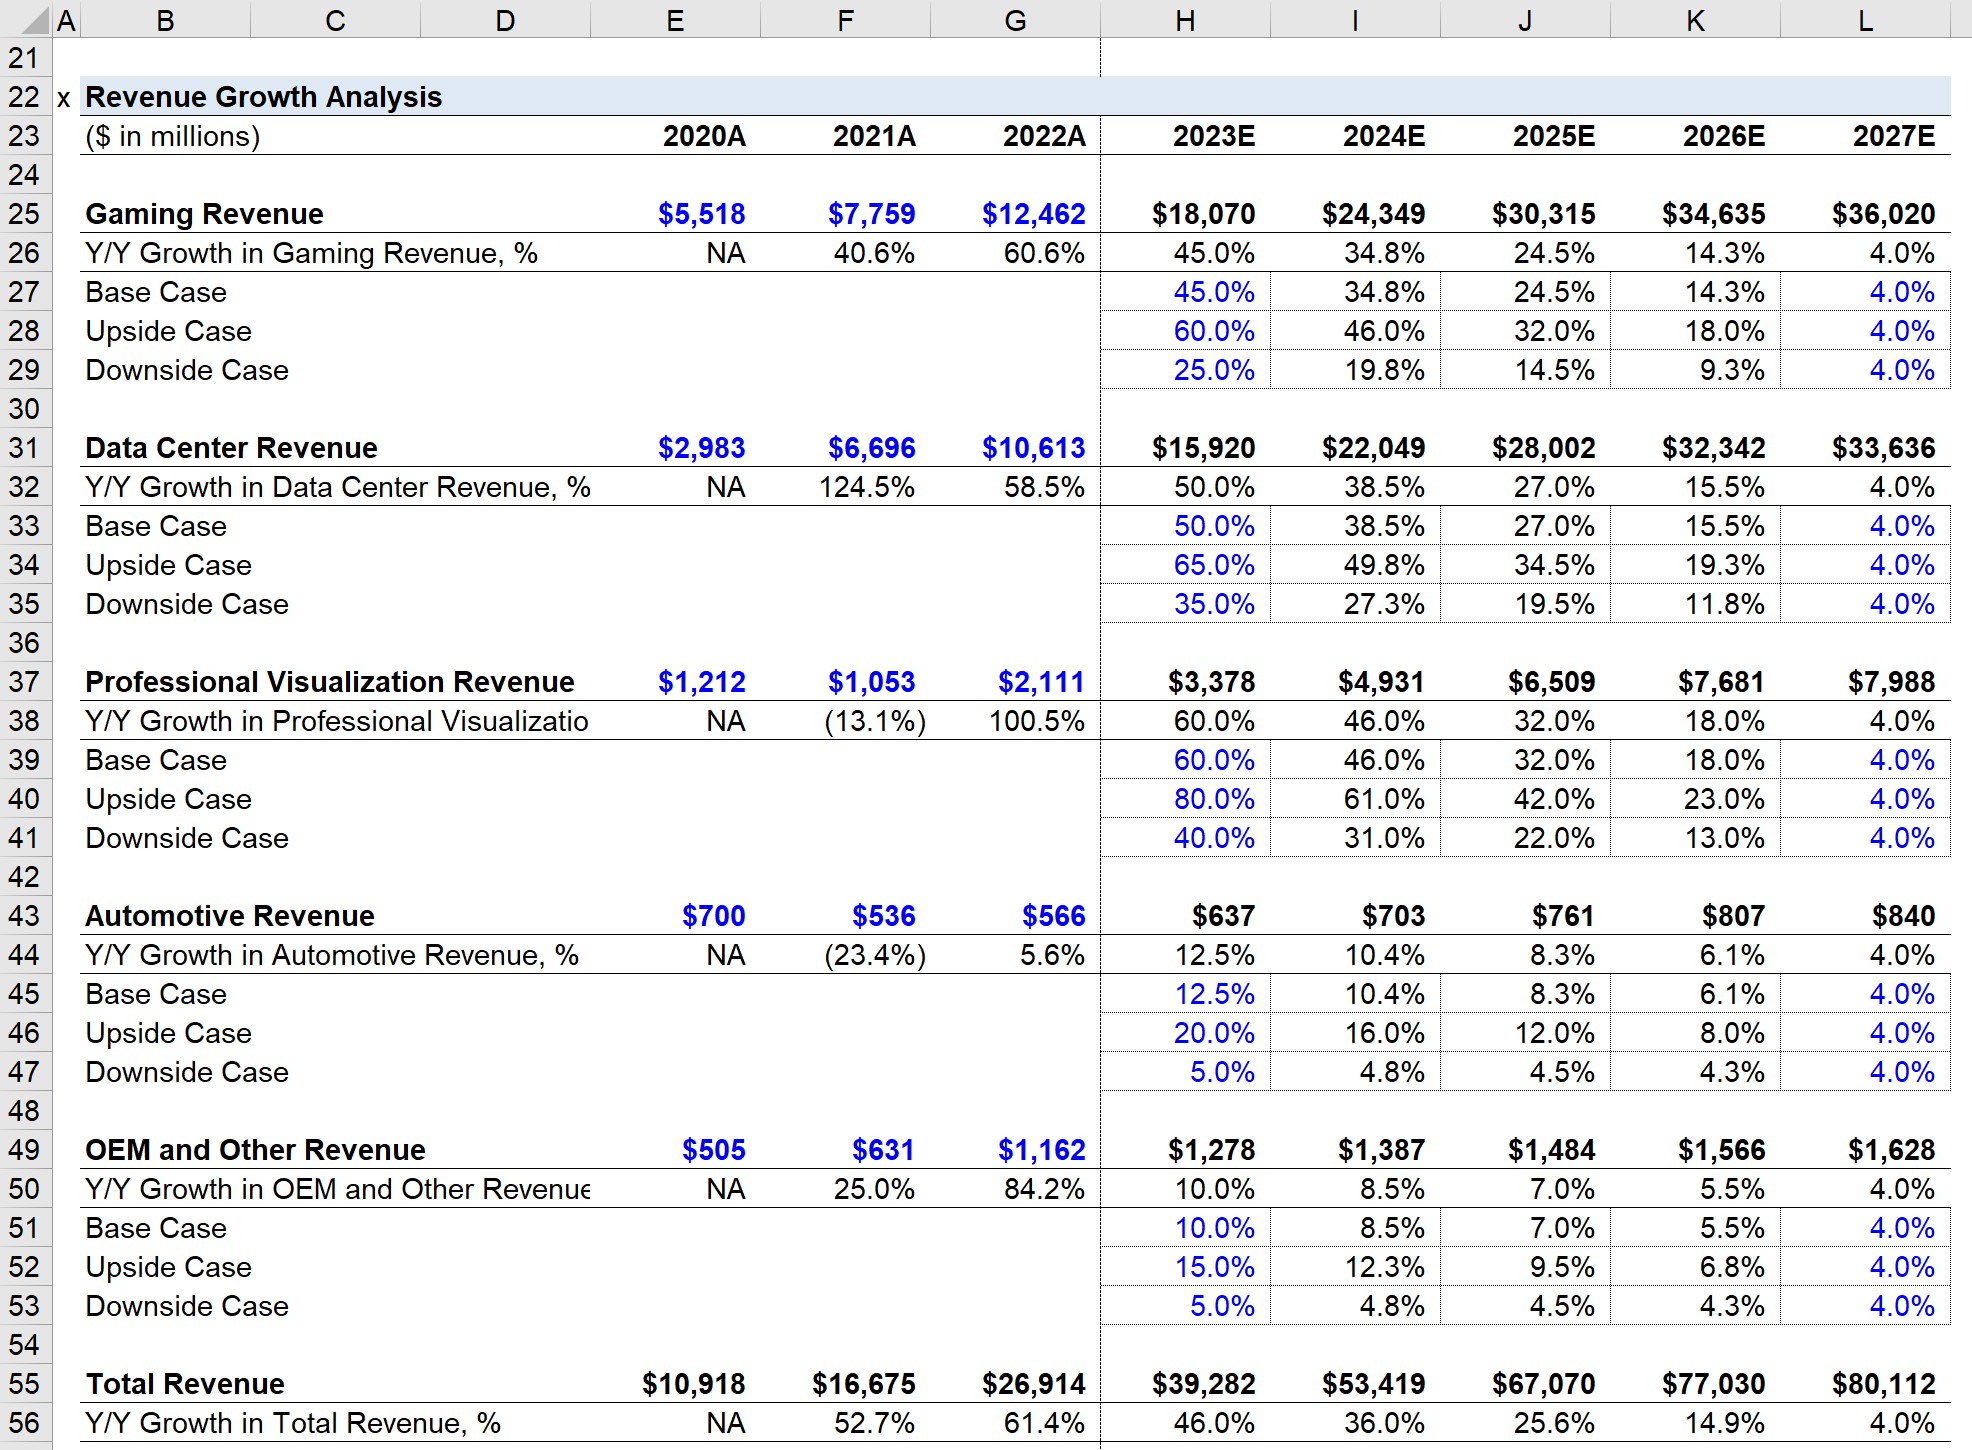
On the income statement, the projected revenue is linked to the bottom of the section, where total revenue is calculated by adding all the different segments for each year.
Case Toggle
The process will be completed under three different scenarios:
- Base Case → The scenario most likely to occur. Typically set below management guidance barring unusual circumstances.
- Upside Case → The best-case scenario, usually directly depicts guidance from management.
- Downside Case → The worst-case scenario in which the company underperforms.
The “OFFSET” function will be used for the chosen scenario to be displayed.
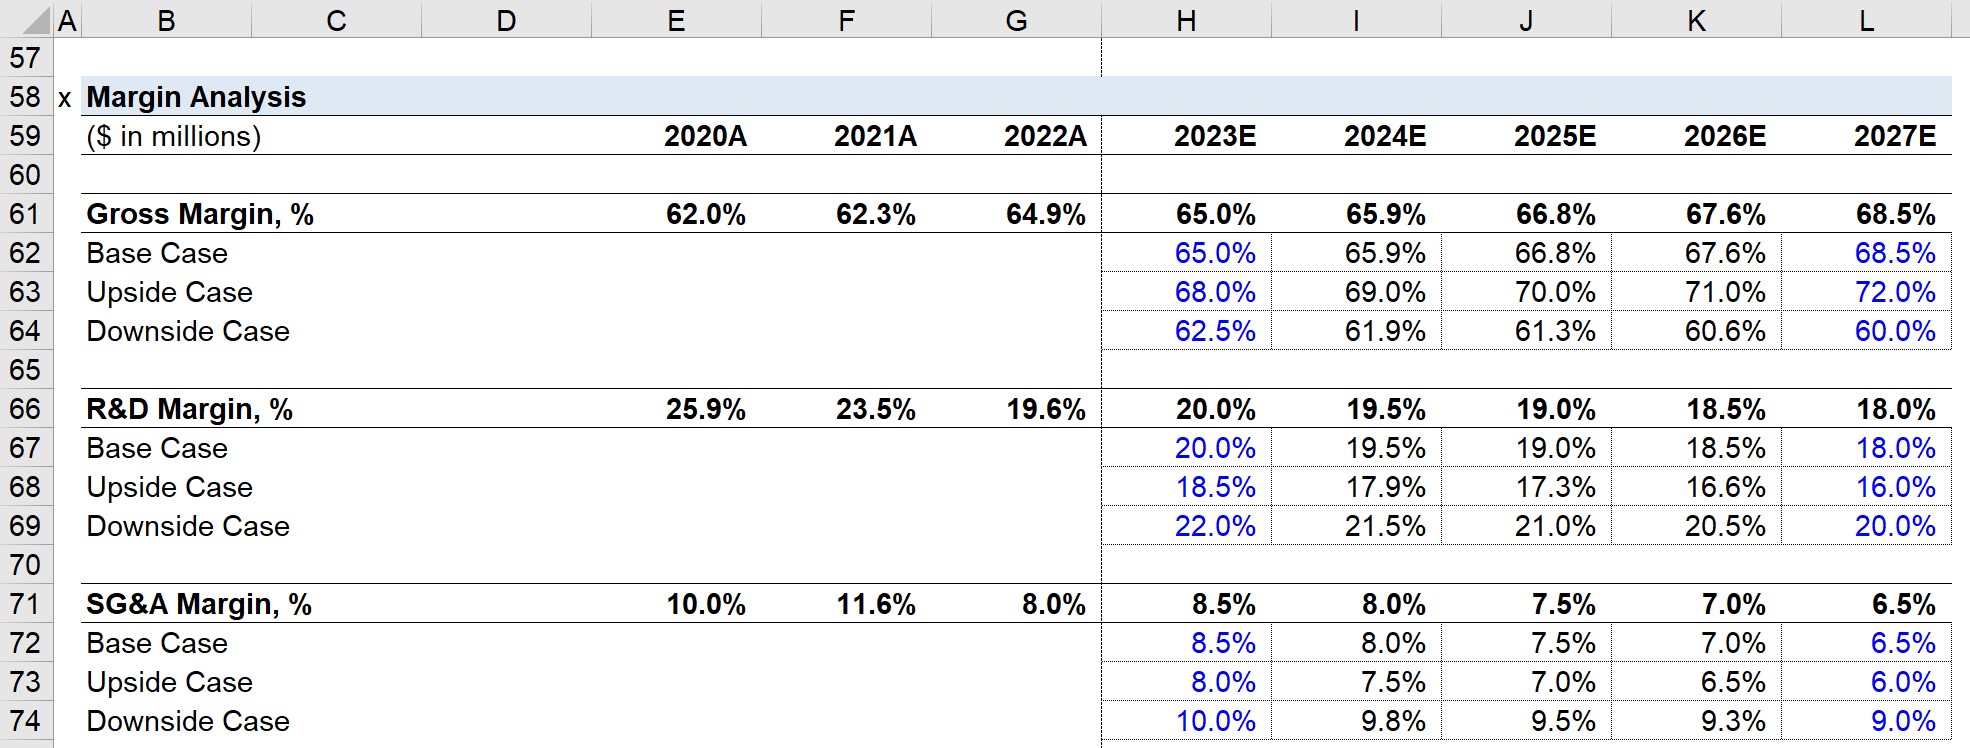
Margin Analysis
There are three assumptions that comprise the margin analysis section.
- Gross Margin, % = Gross Profit / Revenue
- R&D Margin, % = R&D Expense / Revenue
- SG&A Margin, % = SG&A / Revenue
The historical margins are first calculated, and then we’ll make assumptions for the forecast period, using the same process as we did for revenue (i.e. smoothing the growth rate to reach the final year margin assumption and coming up with three distinct scenarios).
Next, to project our income statement, we will use the following formulas:
- Cost of Revenue = (1 – Gross Margin %) * Revenue
- Research and Development = R&D Margin % * Revenue
- Sales, General and Administrative = SG&A Margin % * Revenue
As for our “Income Tax” line item, we’ll assume an effective tax rate of 12.5% and multiply that rate by EBT.
- Income Tax = Tax Rate * EBT
Finally, net income is calculated by subtracting the income tax from EBT.
- Net Income = EBT — Taxes
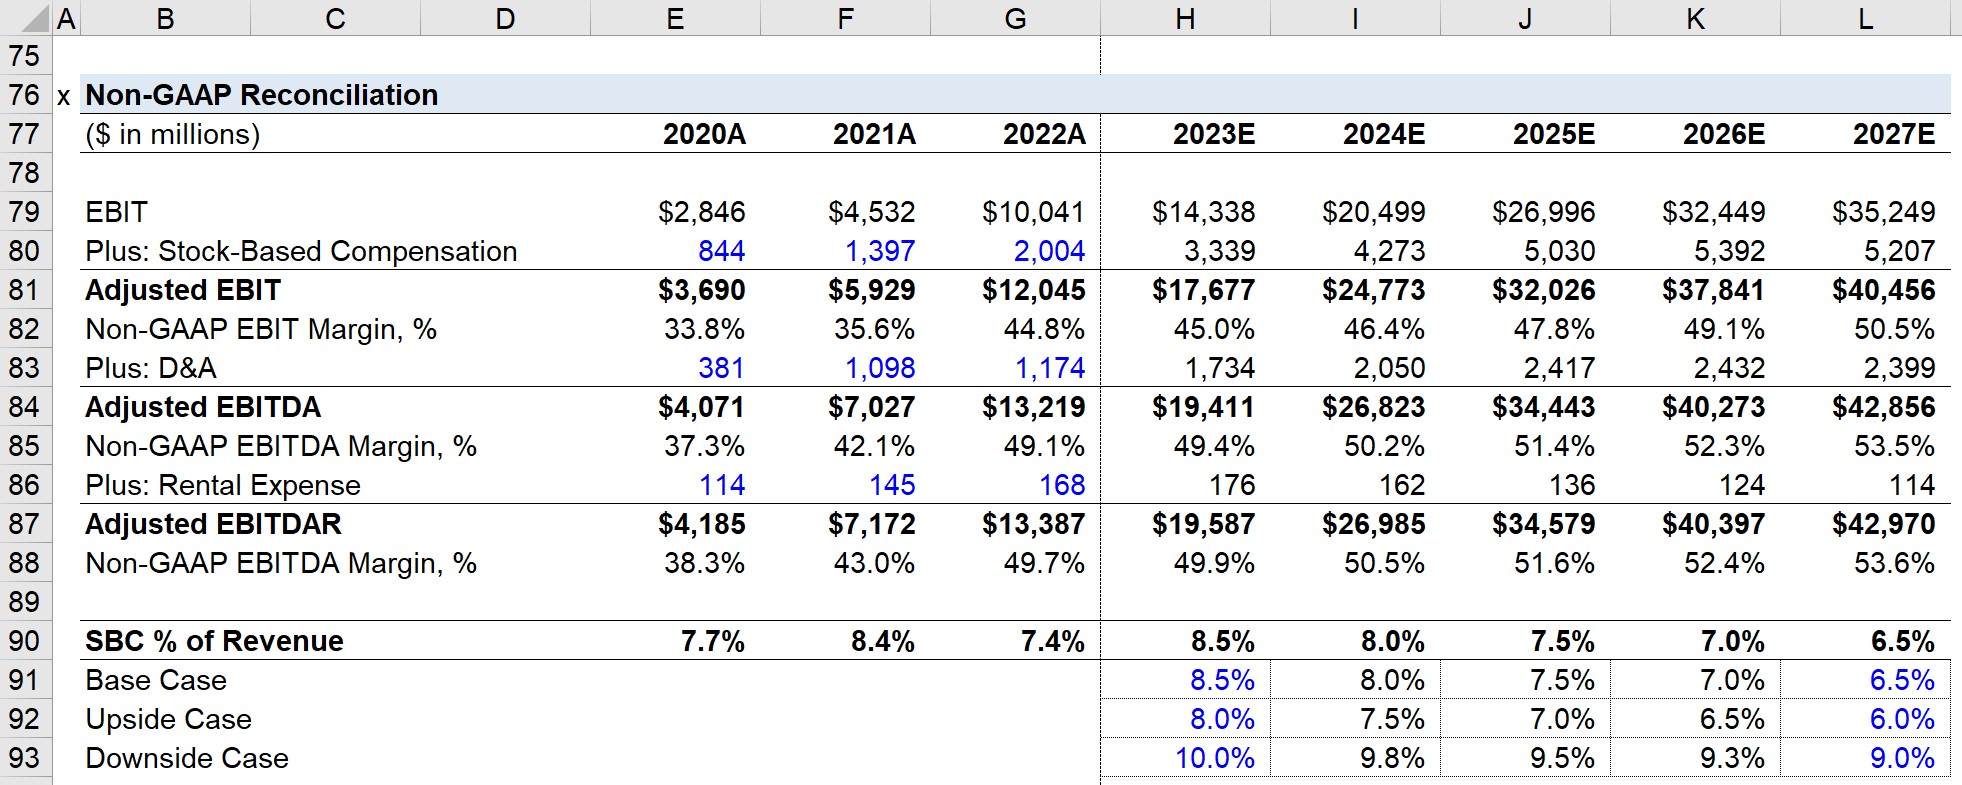
Non-GAAP Reconciliation
Given accrual accounting’s shortcomings, we’ll reconcile the GAAP-based income statement to calculate two metrics:
- Adjusted EBIT = EBIT + Stock-Based Compensation (SBC)
- Adjusted EBITDA + Adjusted EBIT + D&A
Stock-based compensation and D&A should be pulled from the historical cash flow statement.
SBC will be projected as a percentage of revenue, which we’ll assume starts out at 8% and declines to 6% incrementally.
- SBC % of Revenue = SBC / Revenue
- Projected SBC = (SBC % of Revenue) * Revenue
As for D&A, we’ll skip this line item for now, as it is a function of capital expenditures.
NVIDIA Balance Sheet Forecast
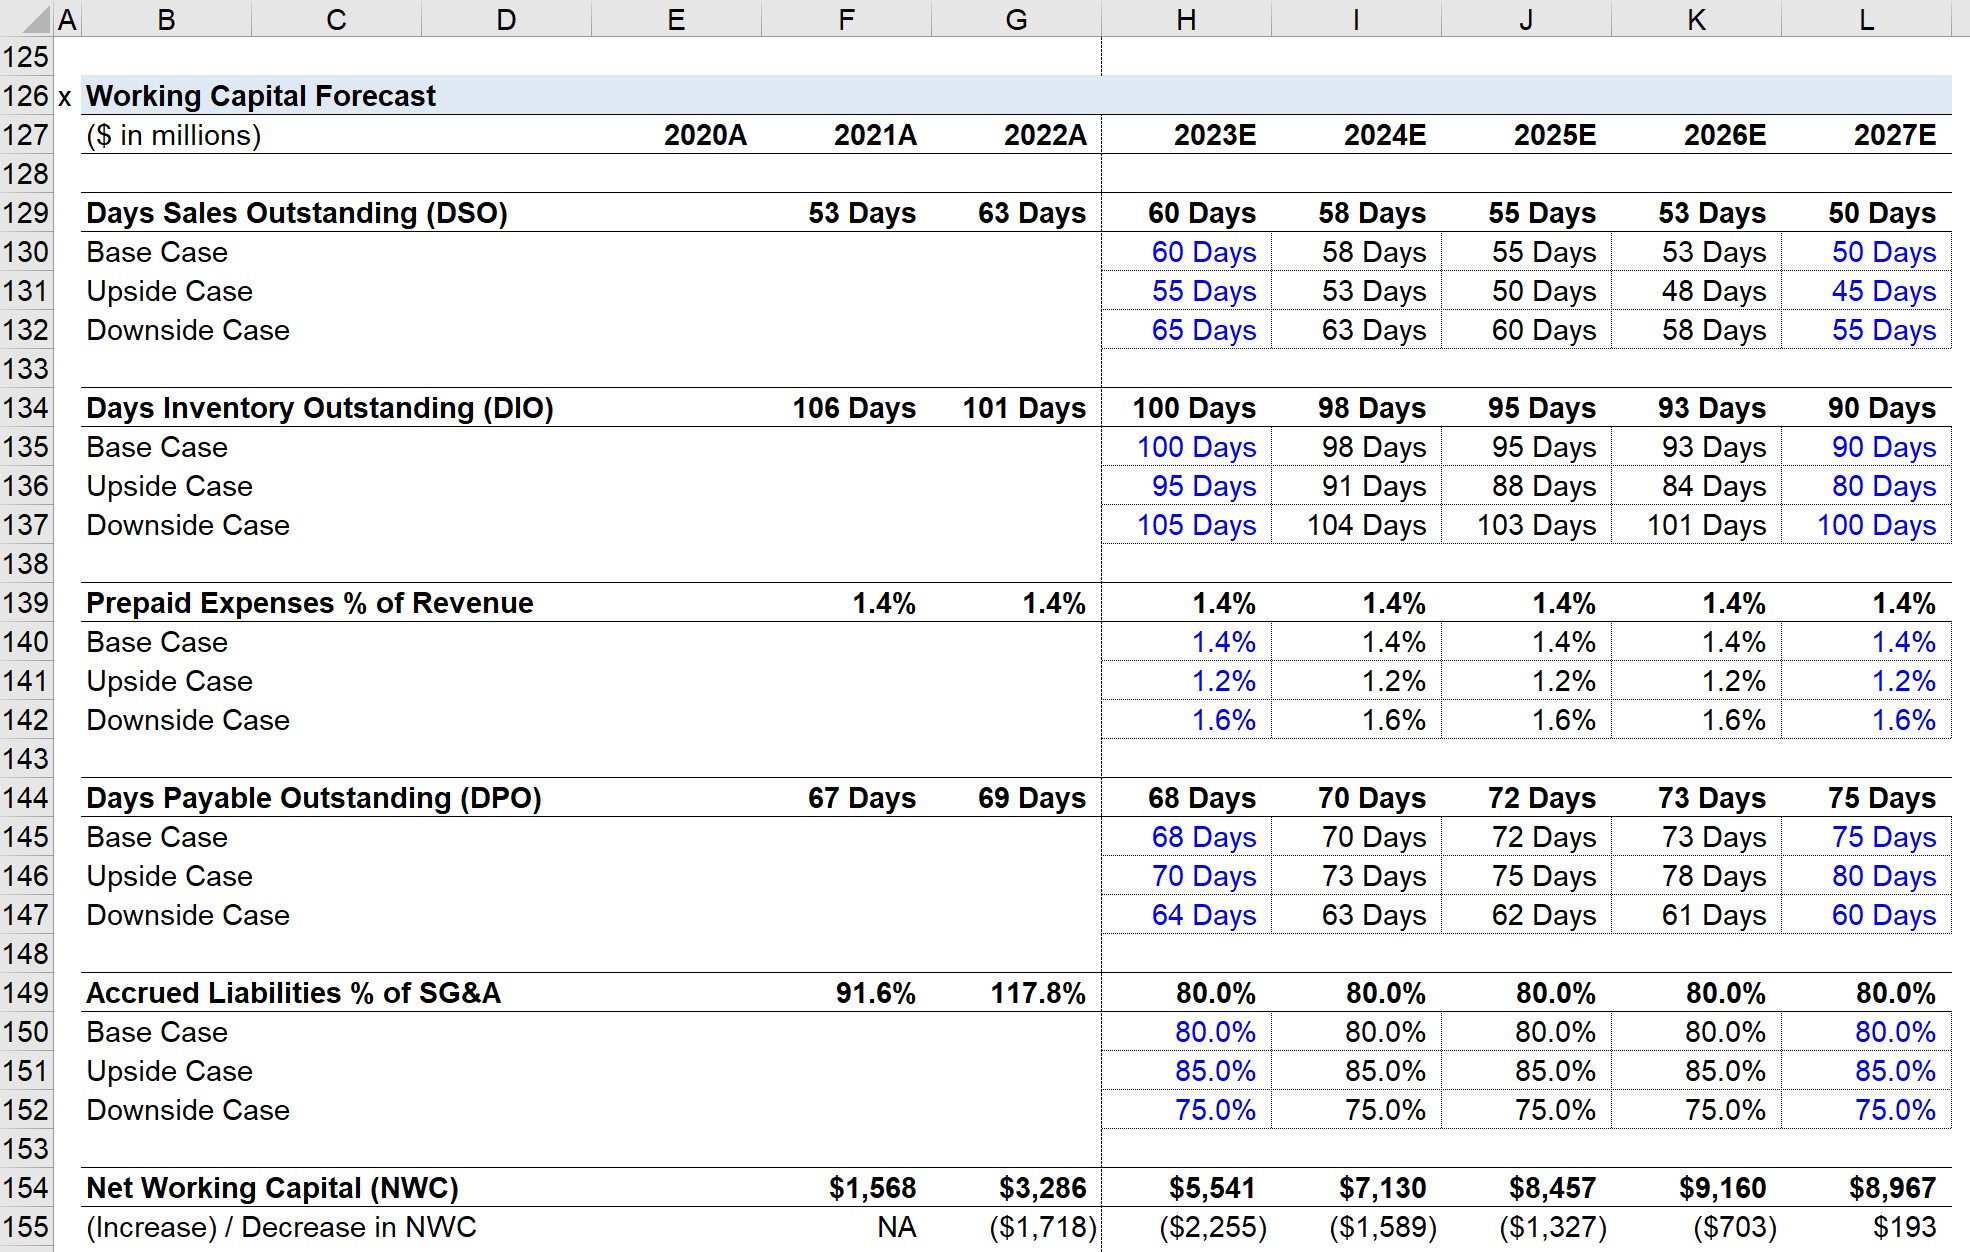
Working Capital Schedule
The first step of projecting the balance sheet is the working capital schedule.
There are five operating working capital line items, which will be projected using the metric on the right:
- Accounts Receivable → Days Sales Outstanding (DSO)
- Inventory → Days Inventory Outstanding (DIO)
- Prepaid Expenses → Prepaid Expenses % of Revenue
- Accounts Payable → Days Payable Outstanding (DPO)
- Accrued Liabilities → Accrued Liabilities % of SG&A
For each historical period, we’ll calculate the ratios and then make assumptions for the forecast period.
At the bottom, we’ll calculate the net working capital (NWC) by subtracting the operating current liabilities from the operating current assets.
Note that cash and cash equivalents, as well as debt and any interest-bearing securities, are excluded in the calculation of NWC.
Upon doing so, we’ll calculate the “(Increase) / Decrease in NWC”.
- An increase in NWC represents an outflow (”use”) of cash
- A decrease in NWC indicates an inflow (”source”) of cash
PP&E and Intangibles Schedule
Forecasting the PP&E and intangibles line items will utilize roll-forward schedules.
The PP&E value will be affected by capital expenditures (i.e. the purchase of PP&E) and depreciation (i.e. the Capex is “spread across” the useful life assumption of the fixed asset).
- PP&E, EoP = PP&E, BoP + Capex – Depreciation
Capex is projected as a percentage of revenue, whereas depreciation will be projected as a percentage of Capex.
As a company matures, the ratio between Capex and depreciation tends to converge towards one, so we’ll apply that to all of our assumptions.
The intangible assets line item is impacted by the amortization expense and goodwill impairment.
Amortization is conceptually identical to depreciation but applies to intangible assets (i.e. assets that cannot be physically touched such as patents).
Goodwill cannot be amortized and is instead periodically checked for impairment, where the asset’s fair value is fallen below the original amount paid for it.
- Intangibles, EoP = Intangibles. BoP – Amortization – Goodwill Impairment
We’ll enter the amortization amounts from NVIDIA’s 10-K and assume zero goodwill impairment for NVIDIA.
For the “Other Long-Term Assets” and “Other Long-Term Liabilities”, we’ll simply keep the values flat through the projection period.
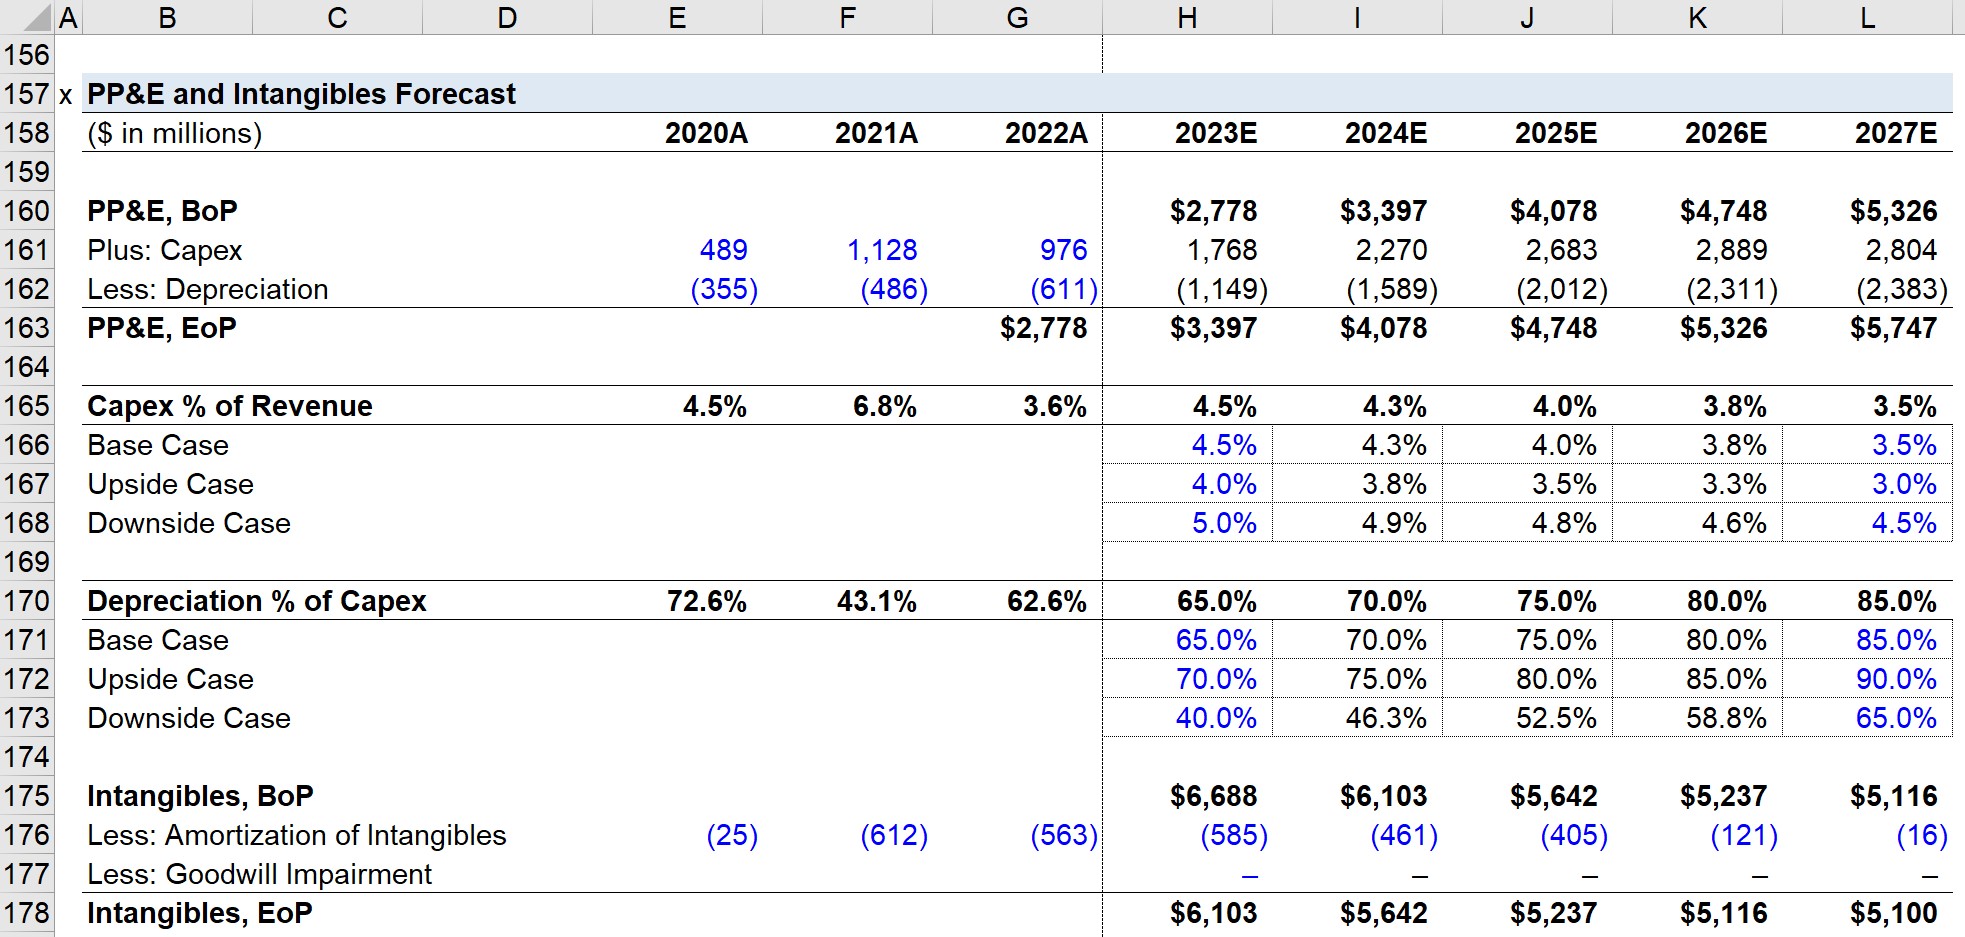
Retained Earnings Calculation
For retained earnings, the projected value is equal to the prior year’s retained earnings plus net income and minus dividends paid to shareholders.
- Retained Earnings, EoP = Retained Earnings, BoP + Net Income – Dividends
Net income is projected on the income statement, while dividends are projected using the dividend payout ratio.
Based on historical trends, we’ll assume the dividend payout ratio to be 3.5% each year.
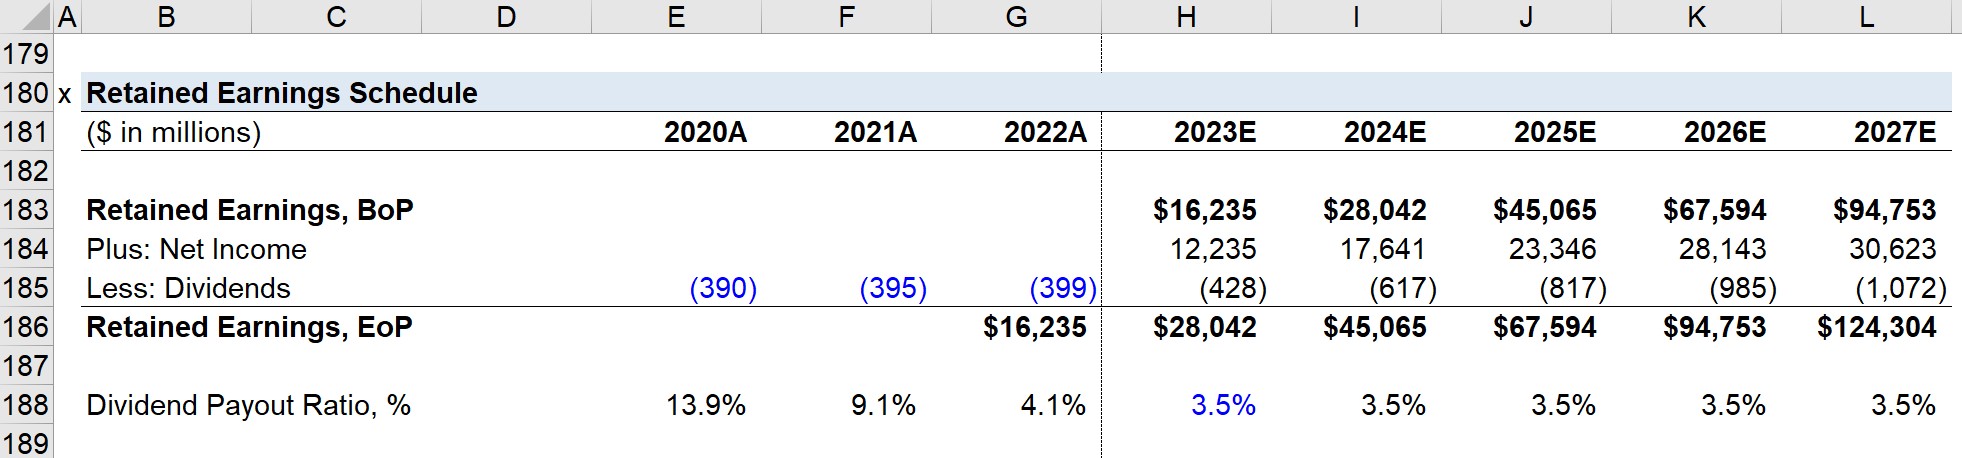
Forecasting the Cash Flow Statement
The cash flow statement consists of three sections:
- Cash Flow from Operating Activities (CFO)
- Cash Flow from Investing Activities (CFI)
- Cash Flow from Financing Activities (CFF)
1. Cash Flow from Operating Activities (CFO)
- For CFO, the starting line item is net income, which we’ll link from the income statement.
- Next, D&A is calculated by adding the projected depreciation and amortization values from our earlier steps.
- The same is done for SBC, which was forecasted as a percentage of revenue.
- For the “Change in NWC”, we’ll simply link to the “(Increase) / Decrease in NWC” line of our working capital schedule.
- “Change in Other Long-Term Assets” captures the change in the items Other Long-Term Assets by subtracting the prior year amount from the current year amount to reflect the correct cash impact.
- “Change in Other Long-Term Liabilities” captures the change in the items “Other Long-Term Liabilities” and “Long-Term Operating Leases”, with the current year amount subtracted from the prior year amount to reflect the right cash impact
2. Cash Flow from Investing Activities (CFI)
- The main item of CFI is capital expenditures, which we forecasted earlier as a percentage of revenue —but ensure that a negative sign is placed in front here since Capex is an outflow of cash.
- Other Investing Activities capture the change in other comprehensive income (OCI).
3. Cash Flow from Financing Activities (CFF)
- The CFF section tends to be more complicated due to the debt schedule, which we’ll create in a separate section.
- Therefore, we’ll leave the debt-related items blank and skip to the Dividend Issuances, which we’ll link to our retained earnings roll-forward.
As the bottom section of our CFS, the cash-roll forward is equal to the BoP balance plus the “Net Change in Cash”, which is the sum of all three sections.
The result is “Cash, EoP”, which flows into the “Cash and Cash Equivalents” line item on the balance sheet.
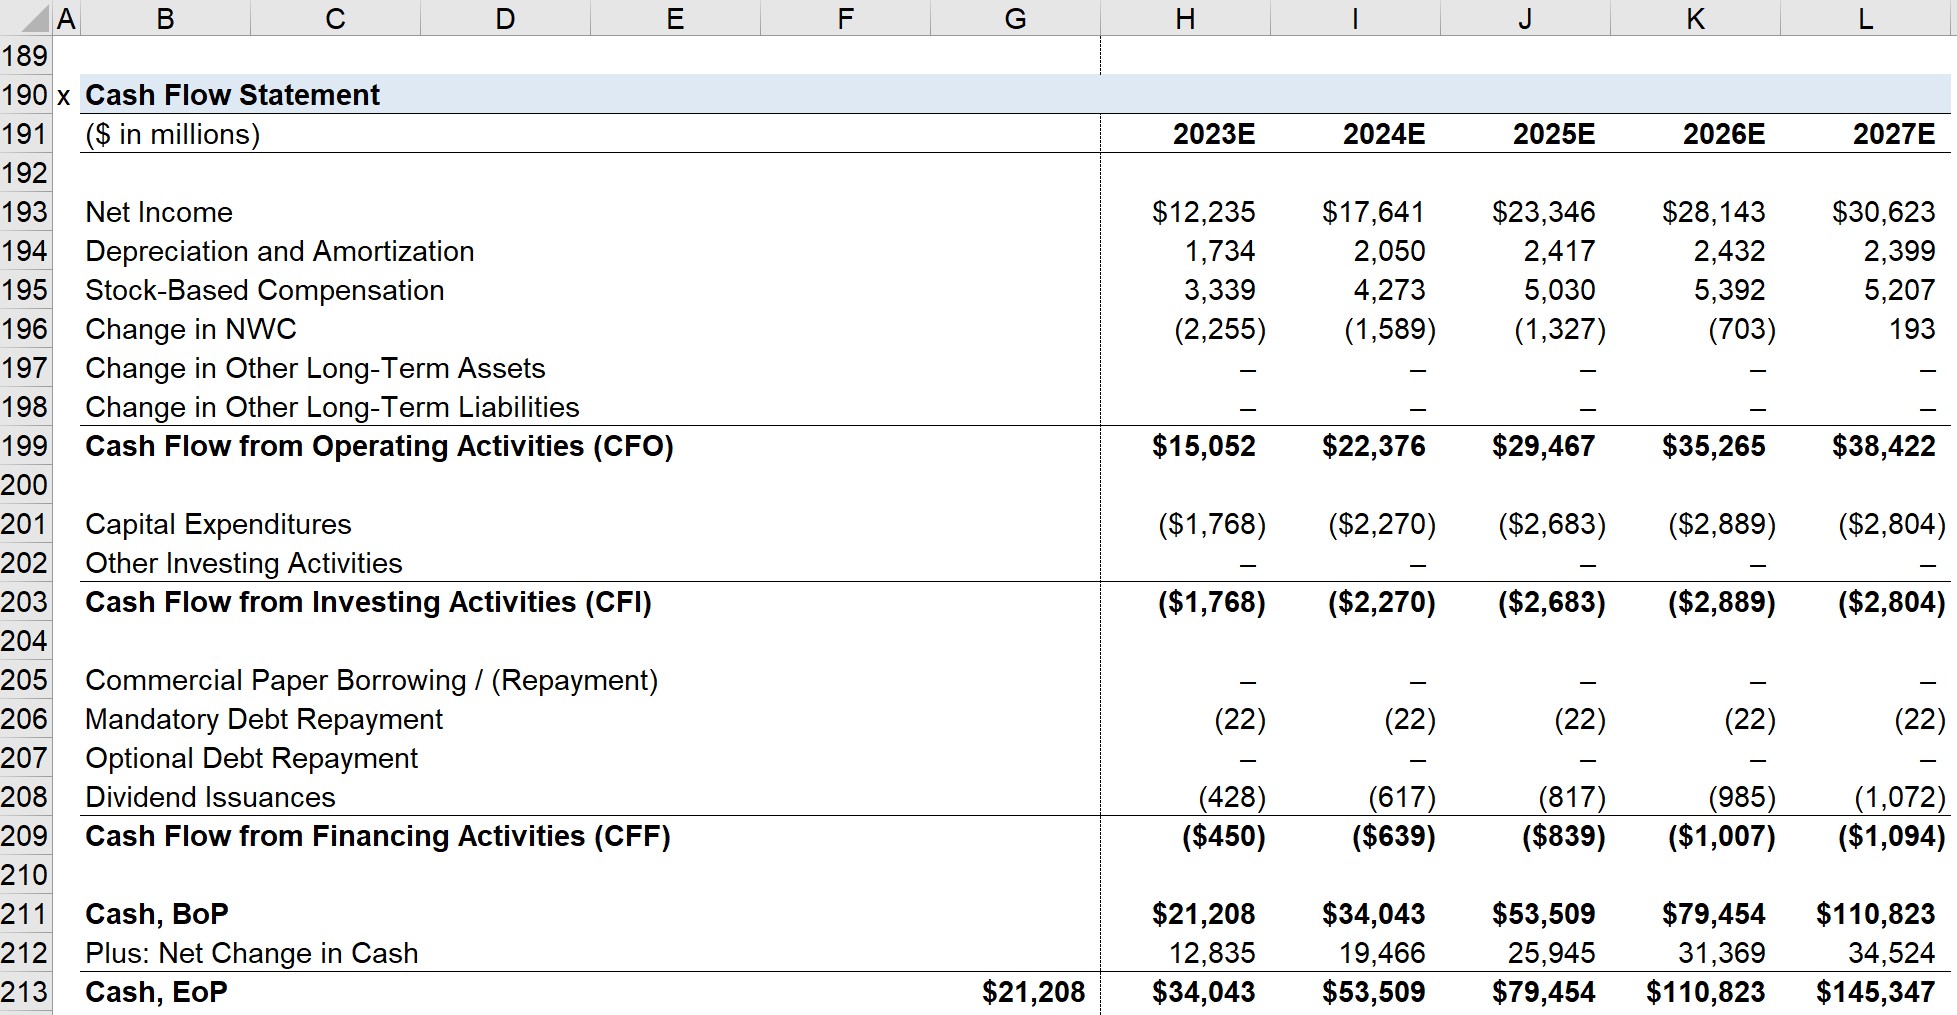
NVIDIA Debt Schedule
The first part is to calculate the free cash flow (FCF) before any debt repayment, which is equal to CFO + CFI + Dividends Issuances.
From FCF, the beginning cash balance is added, the mandatory repayment — which will be linked to later — is subtracted, and the minimum cash balance of $100 is subtracted.
The “FCF, Commercial Paper” is the amount of FCF available to pay down the outstanding short-term debt commercial paper facility.
If necessary, NVIDIA can draw from its $575 million credit facility, which is equal to the BoP balance plus “Borrowing / (Repayment)”, which represents the minimum between the:
- Unused BoP amount
- Minimum Between the BoP balance and “FCF, Commercial Paper”
The “FCF, Pre-Optional Repayment” is equal to the “FCF, Pre-Commercial Paper” added to the “Plus: Borrowing / (Repayment)” line item from the commercial paper roll-forward.
NVIDIA’s “Long-Term Debt” schedule begins with linking to the debt value on the balance sheet as the EoP balance for 2022. Then, that value becomes the BoP balance in the next year, with two deductions:
- “Mandatory Repayment” refers to the scheduled required amortization of the debt principal, which we’ll assume to be only 0.2% each year.
- “Optional Repayment”, also known as the cash sweep, is the repayment of debt principal in advance, which we’ll assume to be zero.
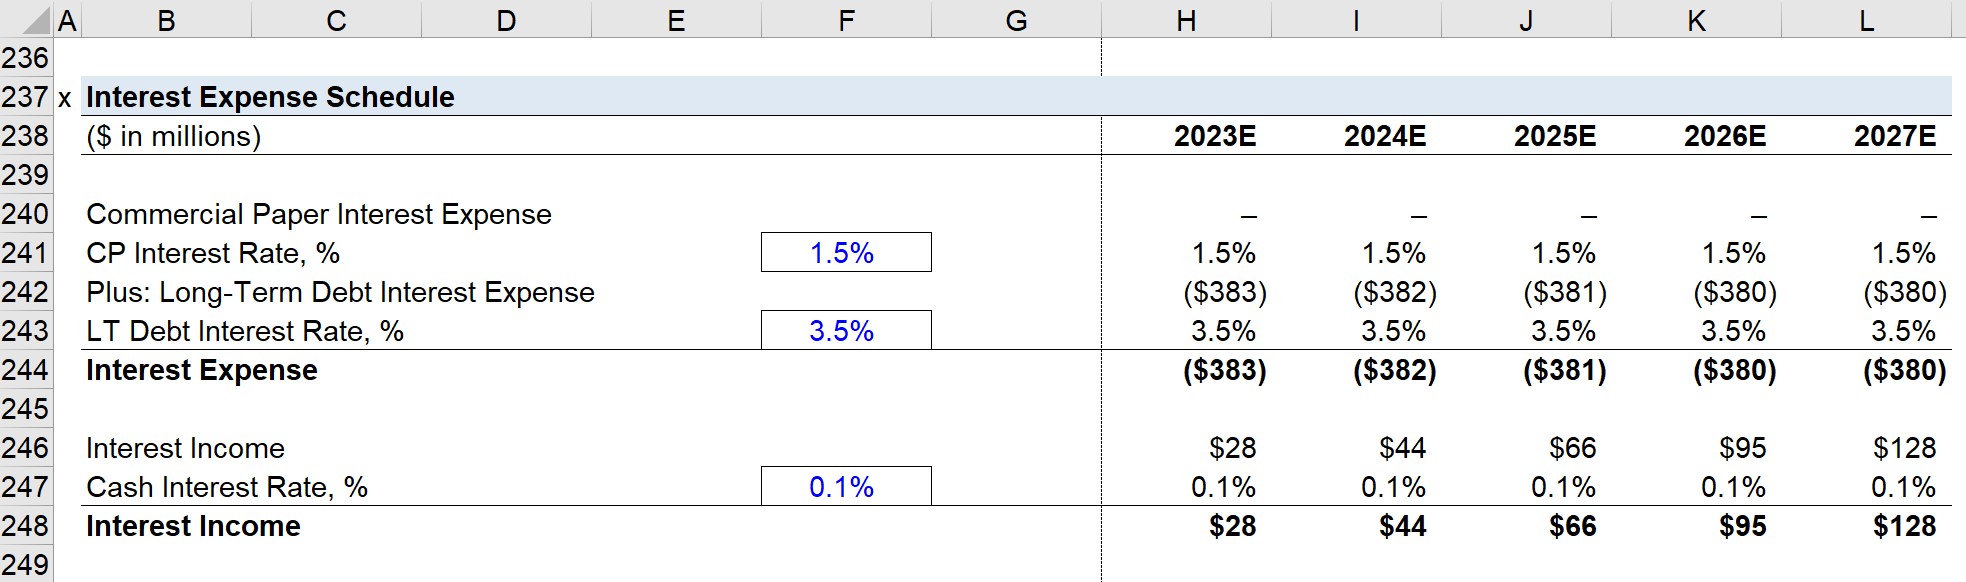
Interest Expense Schedule
With the debt balances complete, we can now create the interest expense schedule.
The interest rate assumptions are as follows:
- Commercial Paper = 1.5%
- Long-Term Debt = 3.5%
For both types of debt, we’ll multiply the average debt balance (i.e. the BoP and EoP) by the interest rate.
Note that this creates a circularity, which means we will need to add a “Circ. Switch” to ensure our model does not “blow up”.
If the switch is set to 0, the interest expense is set at zero to cut the calculation off.
The process is also then completed for “Interest Income”, which represents the earnings generated on cash and cash equivalents, such as marketable securities or short-term investments.
Once complete, we’ll link our EoP debt balances to our balance sheet and interest expense/income to our income statement.
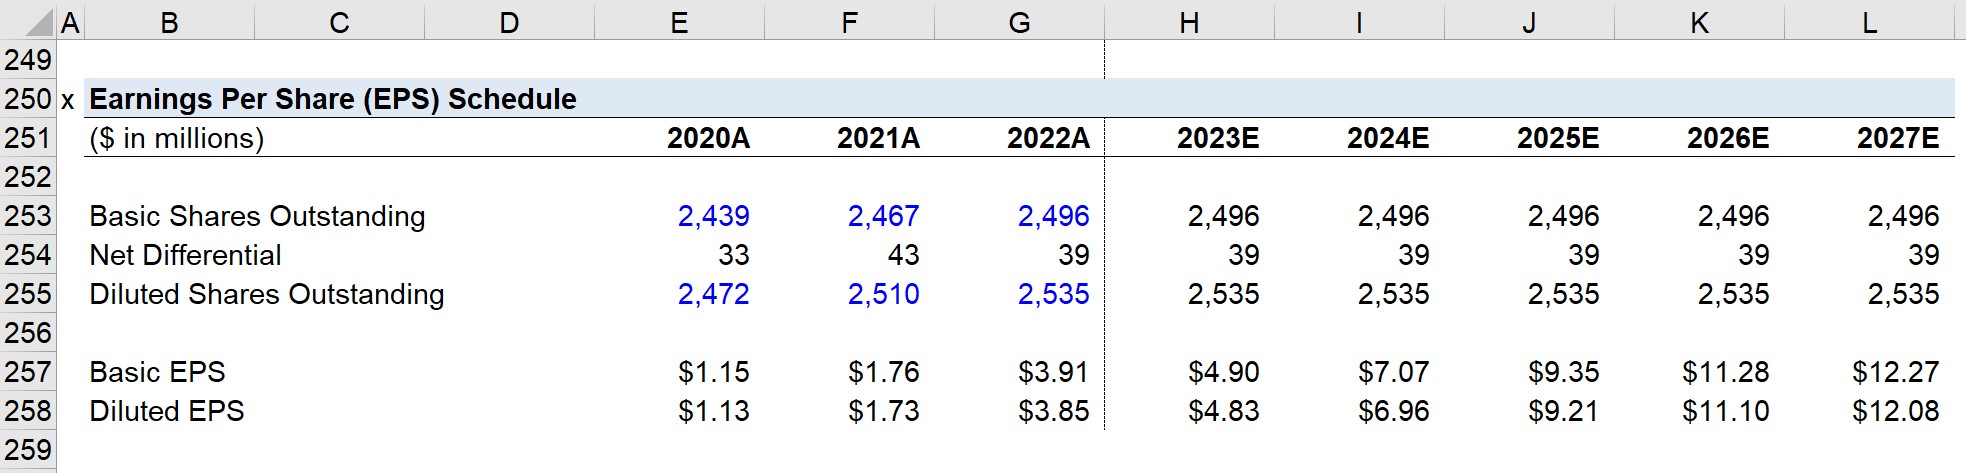
Earnings Per Share (EPS) Schedule
To estimate NVIDIA’s EPS, we’ll enter our historical share price figures (and confirm our calculations match with the EPS shown on the income statement).
We’ll assume no new share issuances or buybacks, so the “Basic Shares Outstanding” line item is kept consistent across the entire forecast (i.e. “straight-lined”).
The “Diluted Shares Outstanding” line item is set equal to the basic share count plus the net differential between the two lines, i.e. we’re assuming no change in share count, which is unrealistic but serves as a simplification for the purposes of this model.
“Basic EPS” and “Diluted EPS” are calculated by dividing net income by the corresponding share count metric.
- Basic EPS = Net Income / Basic Shares Outstanding
- Diluted EPS = Net Income / Diluted Shares Outstanding
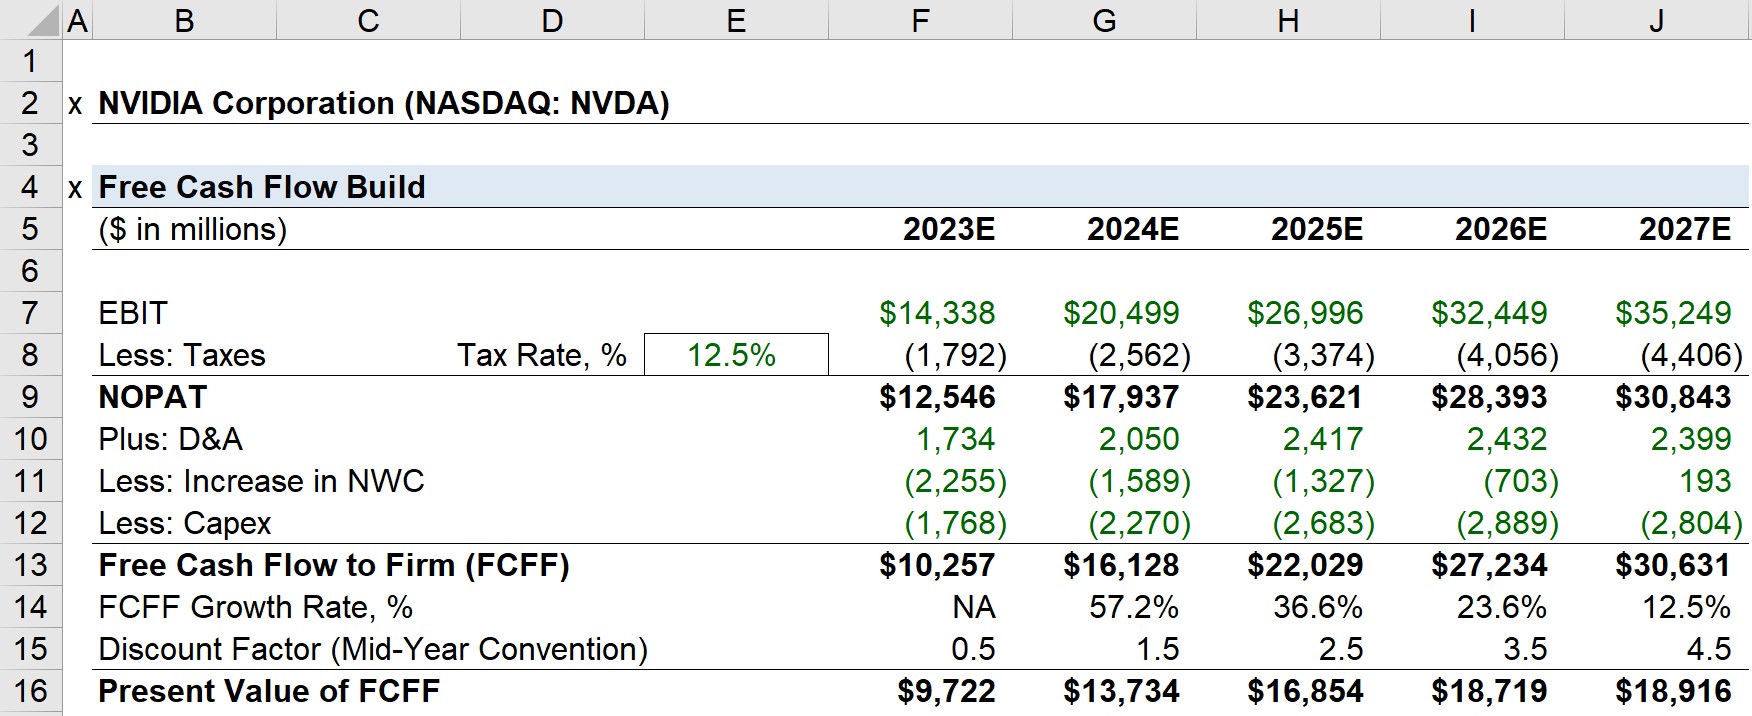
NVIDIA Free Cash Flow Build (FCF)
In our DCF tab, we’ll first create our “Free Cash Flow Build” section, which starts with linking to EBIT from our income statement.
Next, we’ll calculate NOPAT, which stands for “Net Operating Profit After Taxes” and is equal to EBIT subtracted by the tax-affected EBIT.
Afterward, we’ll adjust NOPAT for D&A, Increase in NWC, and Capex, with all three line items linked from the CFS.
The resulting figure is the “Free Cash Flow to Firm (FCFF)” — i.e. the FCFs generated by the core operations of NVIDIA that belongs to all capital providers, both debt and equity.
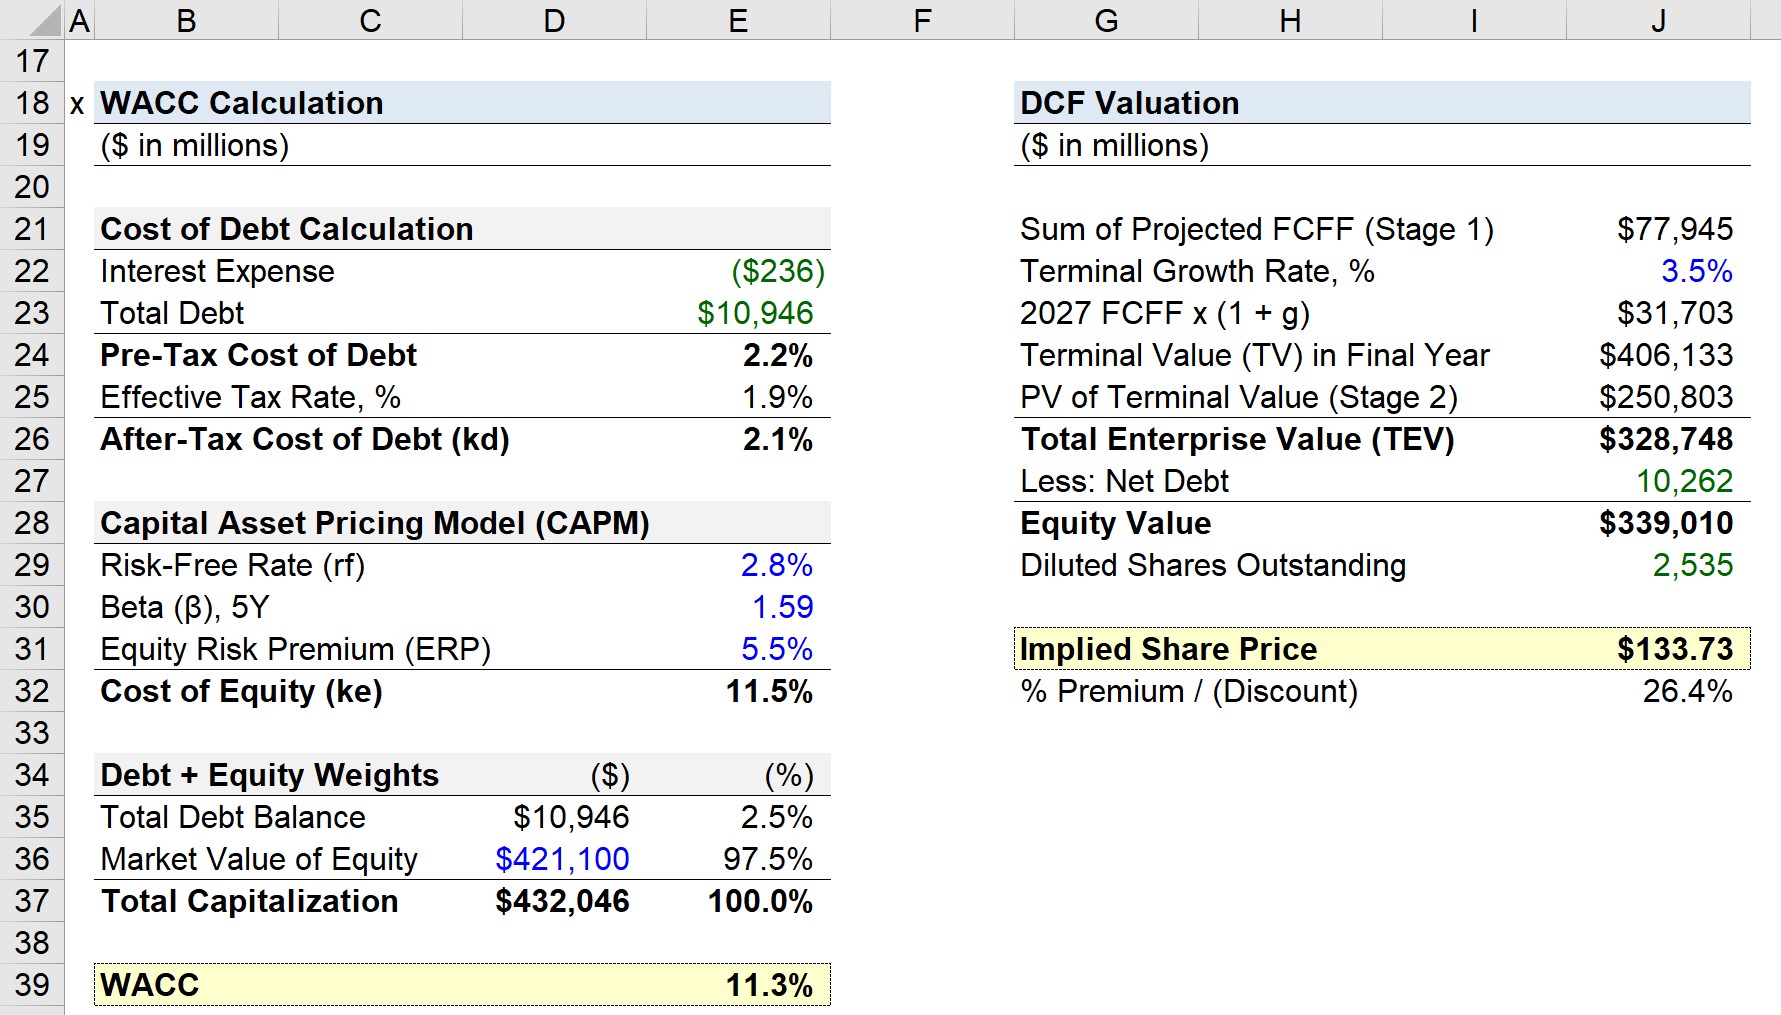
NVIDIA WACC Calculation
Calculating NVIDIA’s WACC consists of two parts: the cost of debt and the cost of equity.
The cost of debt is calculated by dividing the interest expense in 2022 by the total debt outstanding, which comes out to 2.2%.
- Pre-Tax Cost of Debt = Interest Expense / Total Debt
Since interest is tax-deductible, we must multiply it by (1 – tax rate).
The effective tax rate is equal to the income tax divided by EBT, which is 1.9% in 2022.
Technically, we could use the normalized tax rate of 12.5%, but the difference is negligible and not worth spending much on due to NVIDIA’s capitalization.
The cost of equity is calculated using the capital asset pricing model (CAPM).
- Cost of Equity = Risk-Free Rate + Beta * Equity Risk Premium
The risk-free rate will be the yield on the 10-year Treasury as of the valuation date.
NVIDIA’s beta is 1.59 on a 5-year basis according to Capital IQ.
The equity risk premium (ERP) is the excess return from investing in the stock market over the risk-free rate, which we’ll assume is 5.5% per the current recommendation from Duff & Phelps.
- Equity Risk Premium (ERP) = Market Return – Risk-Free Rate
Historically, ERP typically ranges around 5% to 8%
Using those figures, NVIDIA’s cost of equity comes out to be 11.5%.
The WACC formula multiplies the cost of debt and cost of equity by their respective weights (% of total capitalization).
- WACC = (After-Tax Cost of Debt * Debt Weight %) + (Cost of Equity * Equity Weight %)
- WACC = 11.3%
NVIDIA DCF Valuation Analysis
Using the 11.3% WACC, the next step is to discount the FCFF forecasted in the FCF build section.
For each FCFF value, we’ll divide the amount by (1 + WACC) raised to the power of the time period.
Here, we’ll also use the mid-year convention to take into consideration that cash flows are generated throughout the year, rather than all at once at the end of each period.
Since we are building a two-stage DCF model, we’ll start by computing the sum of the projected FCFF in Stage 1.
The terminal value (Stage 2) will be determined using the perpetuity growth method (PGM), in which we’ll assume a growth rate that NVIDIA will grow at into perpetuity.
We’ll assume the terminal growth rate is 3.5%, and grow the 2027 FCFF by that rate.
Then, the terminal value is calculated by dividing the value from the previous step by (WACC – terminal growth rate).
- Terminal Value = [2027 FCFF × (1 + g)] ÷ (WACC – g)
Like our FCFF projection, the terminal value must also be discounted to the present date.
Upon adding Stage 1 and Stage 2, we are left with the implied enterprise value (TEV).
- Implied Enterprise Value (TEV) = PV of Stage 1 FCFF + PV of Stage 2 Terminal Value
To get from the enterprise value to equity value, we subtract net debt (i.e. total debt less cash and equivalents).
- Implied Equity Value = Implied TEV – Net Debt
Operating Leases
For the sake of simplicity, our enterprise value to equity value bridge ignores NVIDIA’s operating leases in the enterprise value calculation.
If we treated operating leases as debt and added them, our enterprise value would pair with the EBITDAR metric rather than EBIT or EBITDA.
The denominator must match the numerator in order for a valuation multiple to be practical, so the exclusion (or inclusion) of operation leases determines which specific metric to use.
DCF Implied Share Price Calculation
Since we have the diluted shares outstanding and the implied equity value, we can calculate the DCF-derived share price using the formula below.
- DCF-Derived Share Price = Implied Equity Value ÷ Diluted Shares Outstanding
In conclusion, NVIDIA should be worth $133.73 per share under our base case, reflecting that the current share price is trading at a 26.4% premium to its intrinsic valuation.

Everything You Need To Master Financial Modeling
Enroll in The Premium Package: Learn Financial Statement Modeling, DCF, M&A, LBO and Comps. The same training program used at top investment banks.
Enroll Today


In the “PP&E, BoP” section, I found where you got he “CapEx” numbers on the Cash Flow statement, but I am unable to find where you got the “Depreciation” amounts. Where would I get those from?
Hi Alan – the depreciation figures can be found on page 68 of NVIDIA’s 10-K.
“Depreciation expense for fiscal years 2022, 2021, and 2020 was $611 million, $486 million, and $355 million, respectively”