
- What is Retained Earnings?
- How to Calculate Retained Earnings
- Retained Earnings Formula
- How to Interpret Retained Earnings
- How to Find Retained Earnings on Balance Sheet
- What is a Good Retained Earnings?
- Retained Earnings vs. Net Income: What is the Difference?
- Retained Earnings Calculator — Excel Template
- 1. Balance Sheet Assumptions
- 2. Retained Earnings Roll-Forward Schedule
- 3. Retained Earnings Calculation Example
- 4. Retained Earnings Calculation Analysis
What is Retained Earnings?
Retained Earnings on the balance sheet measures the accumulated profits kept by a company to date since inception, rather than issued as dividends.
The discretionary decision by management to not distribute payments to shareholders can signal the need for capital reinvestment(s) to sustain existing growth or to fund expansion plans on the horizon.

- The retained earnings on the balance sheet refer to the cumulative profits kept by a corporation, as opposed to the proceeds issued as dividends to shareholders.
- The retained earnings metric measures a company's total profits generated since inception, net of any dividend issuances to shareholders.
- The retained earnings line item is recorded in the shareholders' equity section of the balance sheet.
- The retained earnings formula starts with the prior period's retained earnings balance, adds the current period's net income, and then subtracts shareholder dividends.
How to Calculate Retained Earnings
The retained earnings of a company are the total profits generated since inception, net of any dividend issuances to shareholders.
In simple words, the retained earnings metric reflects the cumulative net income of the company post-adjustments for the distribution of any dividends to shareholders.
The “Retained Earnings” line item is recognized within the shareholders’ equity section of the balance sheet.
The steps to calculate retained earnings on the balance sheet for the current period are as follows.
- Step 1 ➝ Determine Beginning Retained Earnings Balance
- Step 2 ➝ Add Current Period Net Income to Beginning Retained Earnings Balance
- Step 3 ➝ Subtract Dividends Issued to Shareholders
Retained Earnings Formula
The formula to calculate retained earnings starts by adding the prior period’s balance to the current period’s net income minus dividends.
Where:
- Beginning Retained Earnings ➝ The ending retained earnings balance from the prior period, which is recorded in the shareholders’ equity section of the balance sheet.
- Net Income ➝ The net income is the accrual-based accounting measure of profitability and is found on the income statement (i.e. the “bottom line”). Each period, the portion of a company’s net income not paid out as shareholder dividends flows into its retained earnings balance – hence, net income is added to the prior retained earnings account.
- Dividends ➝ The issuance of a dividend, on a per-share basis, can be found in the section below the earnings per share (EPS) data on the income statement. In addition, the gross amount issued can be found on the cash flow statement (CFS) in the cash from financing section.
How to Interpret Retained Earnings
There are numerous factors to consider to accurately interpret a company’s historical retained earnings.
- Company Lifecycle ➝ One influential factor is the maturity of the company, as a low-growth company with minimal opportunities for capital allocation is more likely to issue dividends to shareholders. In other words, its operating cash flow is sufficient to fund reinvestment needs, so management decides the best course of action is to distribute the “excess” cash via shareholder dividends.
- Growth Opportunities ➝ For mature companies, the available opportunities to place capital for expansion and to drive growth become more limited (or the risk profile does not meet the return hurdle). Thus, these sorts of low-growth companies are most likely to pay dividends to shareholders. With that said, a high-growth company with minimal free cash flow will conversely re-invest toward extending its growth trajectory (e.g., research and development, capital expenditures).
- Profit Margins ➝ The profitability of a company must also be considered, especially for growth-oriented companies in hyper-competitive industries. Why? The market participants probably could not afford to issue dividends to shareholders in the first place, even if they wanted to compensate shareholders.
- Corporate Dividend Policy ➝ Next, another important consideration is the dividend policy of the company. Given the formula stated earlier, the relationship between the two should be rather intuitive – i.e., a company that issues dividends routinely is going to have lower retention, all else being equal. Publicly traded companies tend to be reluctant to cut dividends, even after underperformance, out of fear of sending out a negative message to the markets that could cause a decline in share price.
- Industry Cyclicality ➝ The cyclicality of the industry can also be a contributing factor, i.e. when a company operates in a very cyclical industry, the management team reserves more earnings as a risk-averse measure in case of an impending downturn.
How to Find Retained Earnings on Balance Sheet
The screenshot below is the income statement of Apple (NASDAQ: AAPL) for the fiscal year ending 2022.
The dotted red box in the shareholders’ equity section on the balance sheet is where the retained earnings line item is recorded.
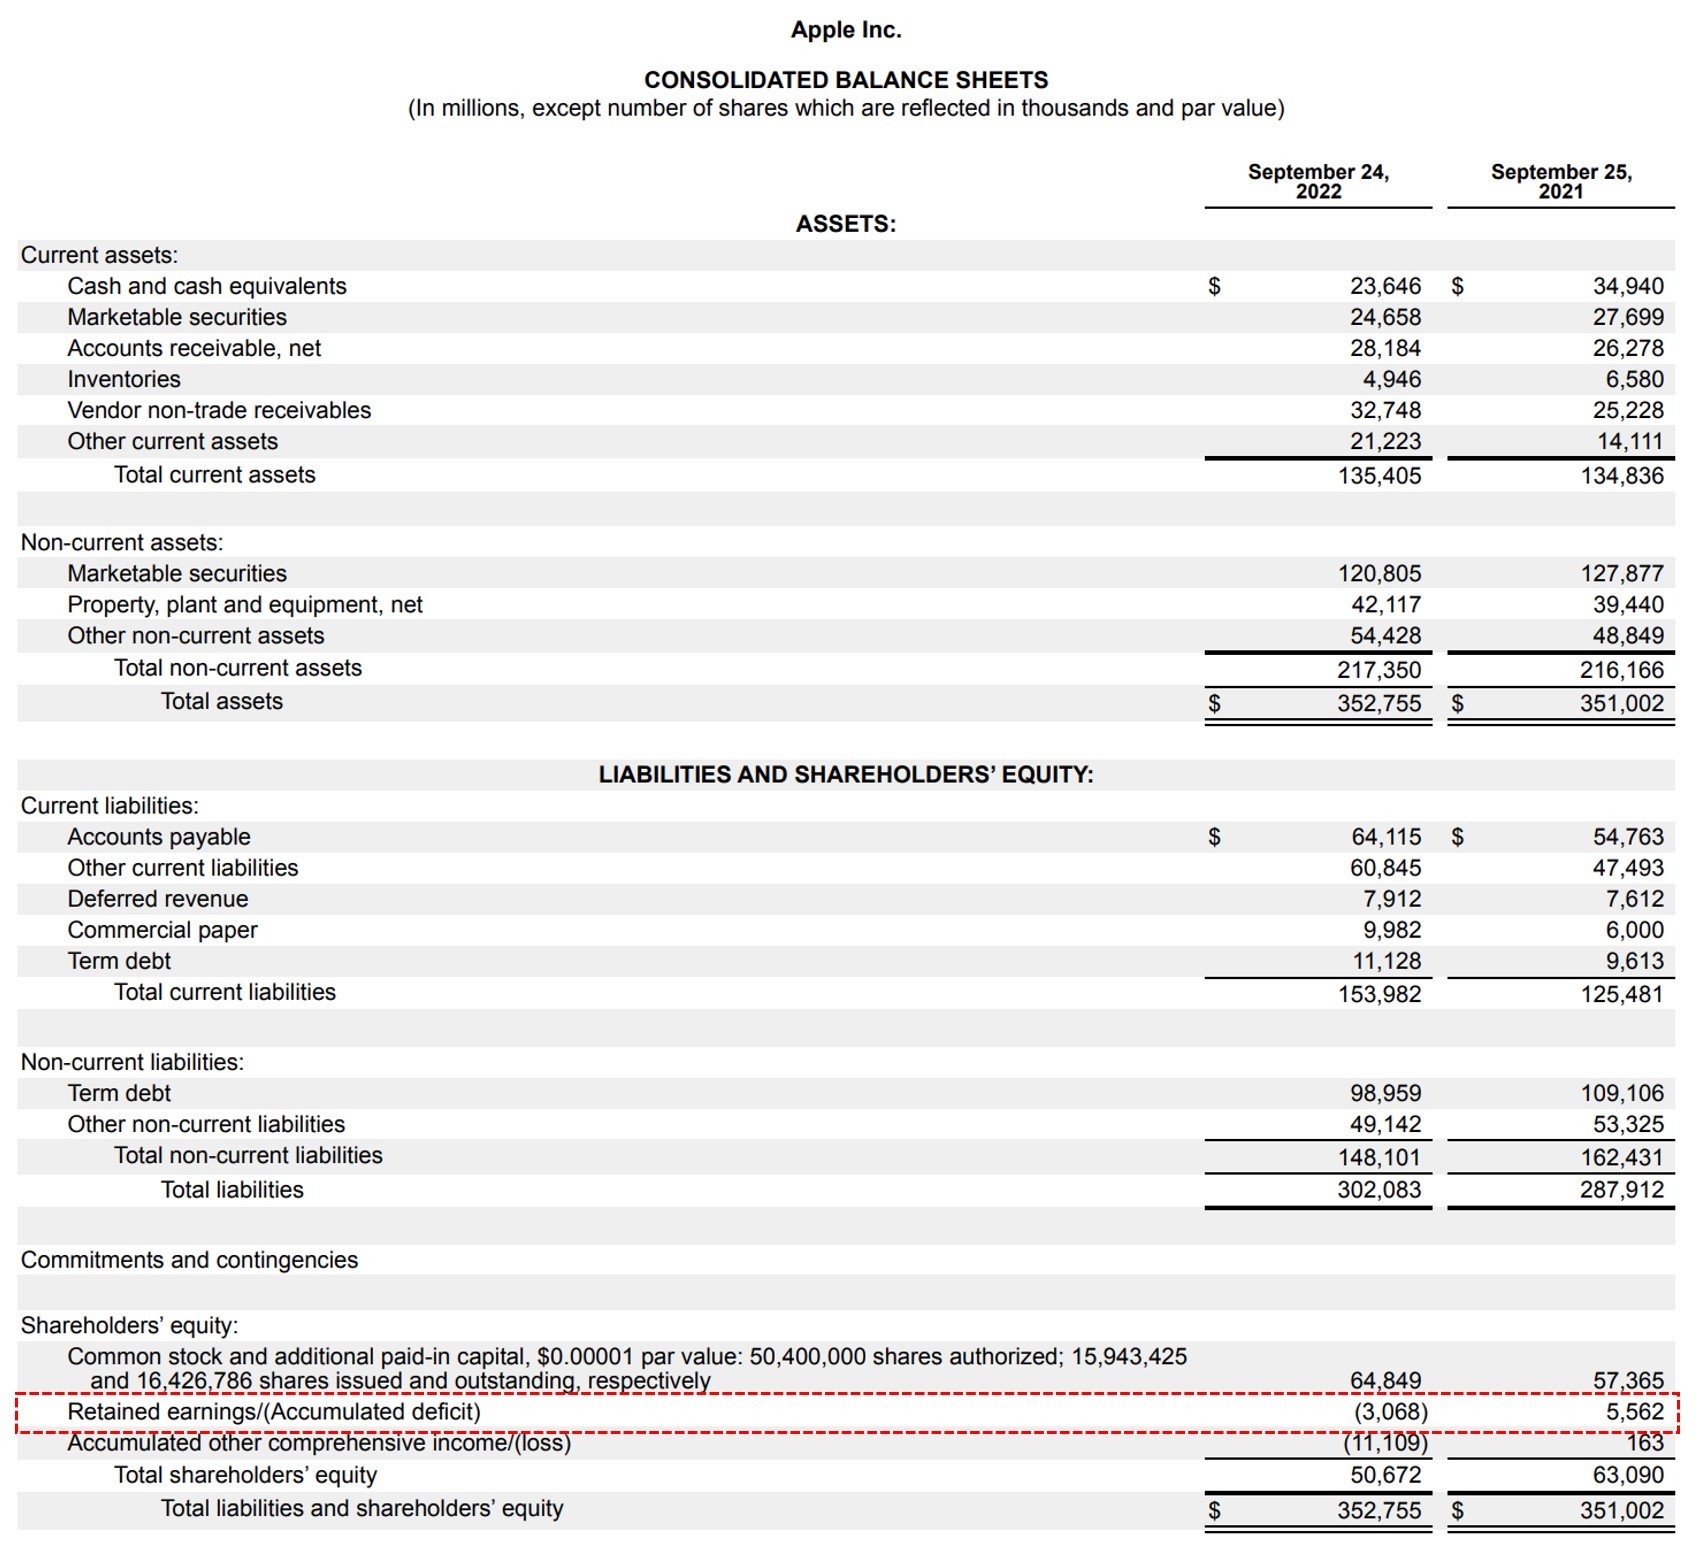
Apple Shareholders’ Equity Section of Balance Sheet (Source: AAPL 10-K)
What is a Good Retained Earnings?
Generally speaking, a company with more retained earnings on its balance sheet is more profitable, since higher retained earnings represent more net earnings and fewer distributions to shareholders (and vice versa).
If the retained earnings balance is gradually accumulating in size, this demonstrates a track record of profitability (and a more optimistic outlook).
In contrast, if a company has consistently incurred substantial losses at the net income line item (the “bottom line”), its retained earnings balance could eventually become negative, which is recorded as an “accumulated deficit” on the books.
But while the first scenario is a cause for concern, a negative balance could also result from an aggressive dividend payout, such as a dividend recapitalization in a leveraged buyout (LBO).
From a more cynical view, even positive growth in a company’s retained earnings balance could be interpreted as the management team struggling to find profitable investments and opportunities worth pursuing.
Retained Earnings vs. Net Income: What is the Difference?
The process of calculating a company’s retained earnings in the current period initially starts with determining the prior period’s retained earnings balance (i.e., the beginning of the period).
From there, the company’s net income—the “bottom line” of the income statement—is added to the prior period balance.
The prior period balance can be found on the opening balance sheet, whereas the net income is linked to the current period income statement.
In the final step of building the roll-forward schedule, the issuance of dividends to equity shareholders is subtracted to arrive at the current period’s retained earnings balance (i.e., the end of the period).
The intuition for deducting dividends in the retained earnings formula is that if a company were to decide to pay dividends to its shareholders, the proceeds come out of the company’s net income (and thus reduce retained earnings).
Retained Earnings Calculator — Excel Template
We’ll now move to a modeling exercise, which you can access by filling out the form below.
1. Balance Sheet Assumptions
For our retained earnings modeling exercise, the following assumptions will be used for our hypothetical company as of the last twelve months (LTM), or Year 0.
Operating Assumptions (Year 0)
- Retained Earnings – Beginning of Period (BoP) = $200 million
- Net Income = $50 million
- Common Dividends = $10 million
Upon combining the three line items, we arrive at the end-of-period balance – for instance, Year 0’s ending balance is $240m.
- Retained Earnings (Year 0) = $200 million + $50 million – $10 million = $240 million
Note: Net income in our illustrative roll-forward schedule has a positive impact on the end-of-period balance (cash “inflow”) while common dividends have a negative effect (cash “outflow”).
2. Retained Earnings Roll-Forward Schedule
In the next step, we’ll forecast the metric for the next five years, with two operating cases to pick from:
- Upside Case → Consistent operating performance with profit margins in line with historical trends – therefore, the common dividend issuance program remains in place.
- Downside Case → Poor operating performance with declining profitability – management is forced to cut the dividend (and eventually put a complete end to the payouts in later periods)
Upside Case – Forecast Assumptions
- Net Income → Straight-Line (i.e. Held Constant)
- Common Dividends → Straight-Line
Downside Case – Forecast Assumptions
- Net Income → Reduction by $25 million (Step Function)
- Common Dividends → Payout Value Decline of $2 million (Step Function)
3. Retained Earnings Calculation Example
In the “Upside Case”, the ending balance increases from $240 million in Year 0 to $440 million by Year 5 – reflecting how management’s decision to retain a greater proportion of its net income has a net positive impact on the retained earnings balance.

4. Retained Earnings Calculation Analysis
As for the “Downside Case”, the ending balance declined from $240 million in Year 0 to $95 million by the end of Year 5 – even with the company attempting to offset the steep losses by gradually cutting off the dividend payments.


Everything You Need To Master Financial Modeling
Enroll in The Premium Package: Learn Financial Statement Modeling, DCF, M&A, LBO and Comps. The same training program used at top investment banks.
Enroll Today
")
")
")

