
What is PP&E?
Property, Plant, and Equipment (PP&E) refers to a company’s tangible fixed assets that are expected to provide positive economic benefits over the long term (> 12 months).

How to Calculate PP&E
PP&E stands for “Property, Plant and Equipment” and is a line item recorded on the non-current assets section of the balance sheet.
For most companies, particularly those operating in capital-intensive industries (e.g. manufacturing, industrials), fixed assets are a critical part of their overall business model and the ability to continue generating revenue over the long term.
Since PP&E is a long-term asset, the purchase of these fixed assets – i.e. capital expenditures (Capex) – is not expensed immediately during the period incurred.
In an effort to match the revenues from the fixed asset with the cost to abide by the matching principle under GAAP accounting, the carrying value is instead decreased by depreciation over its useful life assumption.
- Useful Life → The useful life assumption is the estimated number of years that the fixed asset is expected to offer benefits to the company.
- Depreciation → The annual depreciation expense is equal to the total Capex amount minus the salvage value, which is then divided by the useful life assumption of the fixed asset.
The depreciation expense is recognized on the income statement to allocate the capital expenditure amount across the asset’s useful life.
But on the cash flow statement (CFS), depreciation is added back since it is a non-cash expense (i.e. there is no real cash outflow), while the capital expenditures (capex) appears in the cash flow from investing activities section in the period incurred.
What are Examples of PP&E?
Common examples of assets that are categorized as property, plant and equipment (PP&E) include the following:
- Buildings
- Equipment
- Machinery
- Offices Furniture
- Fixtures
- Computers
- Vehicles (Trucks, Cars)
PP&E Formula
The carrying value of a company’s property, plant and equipment balance is affected by two primary factors:
- Capital Expenditures (Capex) → Maintenance Capex and Growth Capex
- Depreciation → Depreciable Base ÷ Useful Life Assumption
The formula to calculate the ending PP&E balance consists of adding Capex to the beginning PP&E balance and then subtracting the depreciation expense.
However, it is important to confirm that Capex and depreciation have the correct impact on PP&E.
- Capex → Increase in PP&E Balance
- Depreciation → Decrease in PP&E Balance
The capital expenditures (Capex) line item is often linked to the cash flow statement in financial models, so there will usually be a negative sign in front.
In that case, the Excel formula should subtract capital expenditures (i.e. two negatives make a positive) rather than adding it for the intended effect, i.e. the beginning balance should increase by the Capex spending amount.
The depreciation expense should have the opposite effect, so we must confirm that depreciation reduces the carrying value.
PP&E Calculator
We’ll now move to a modeling exercise, which you can access by filling out the form below.
PP&E Calculation Example
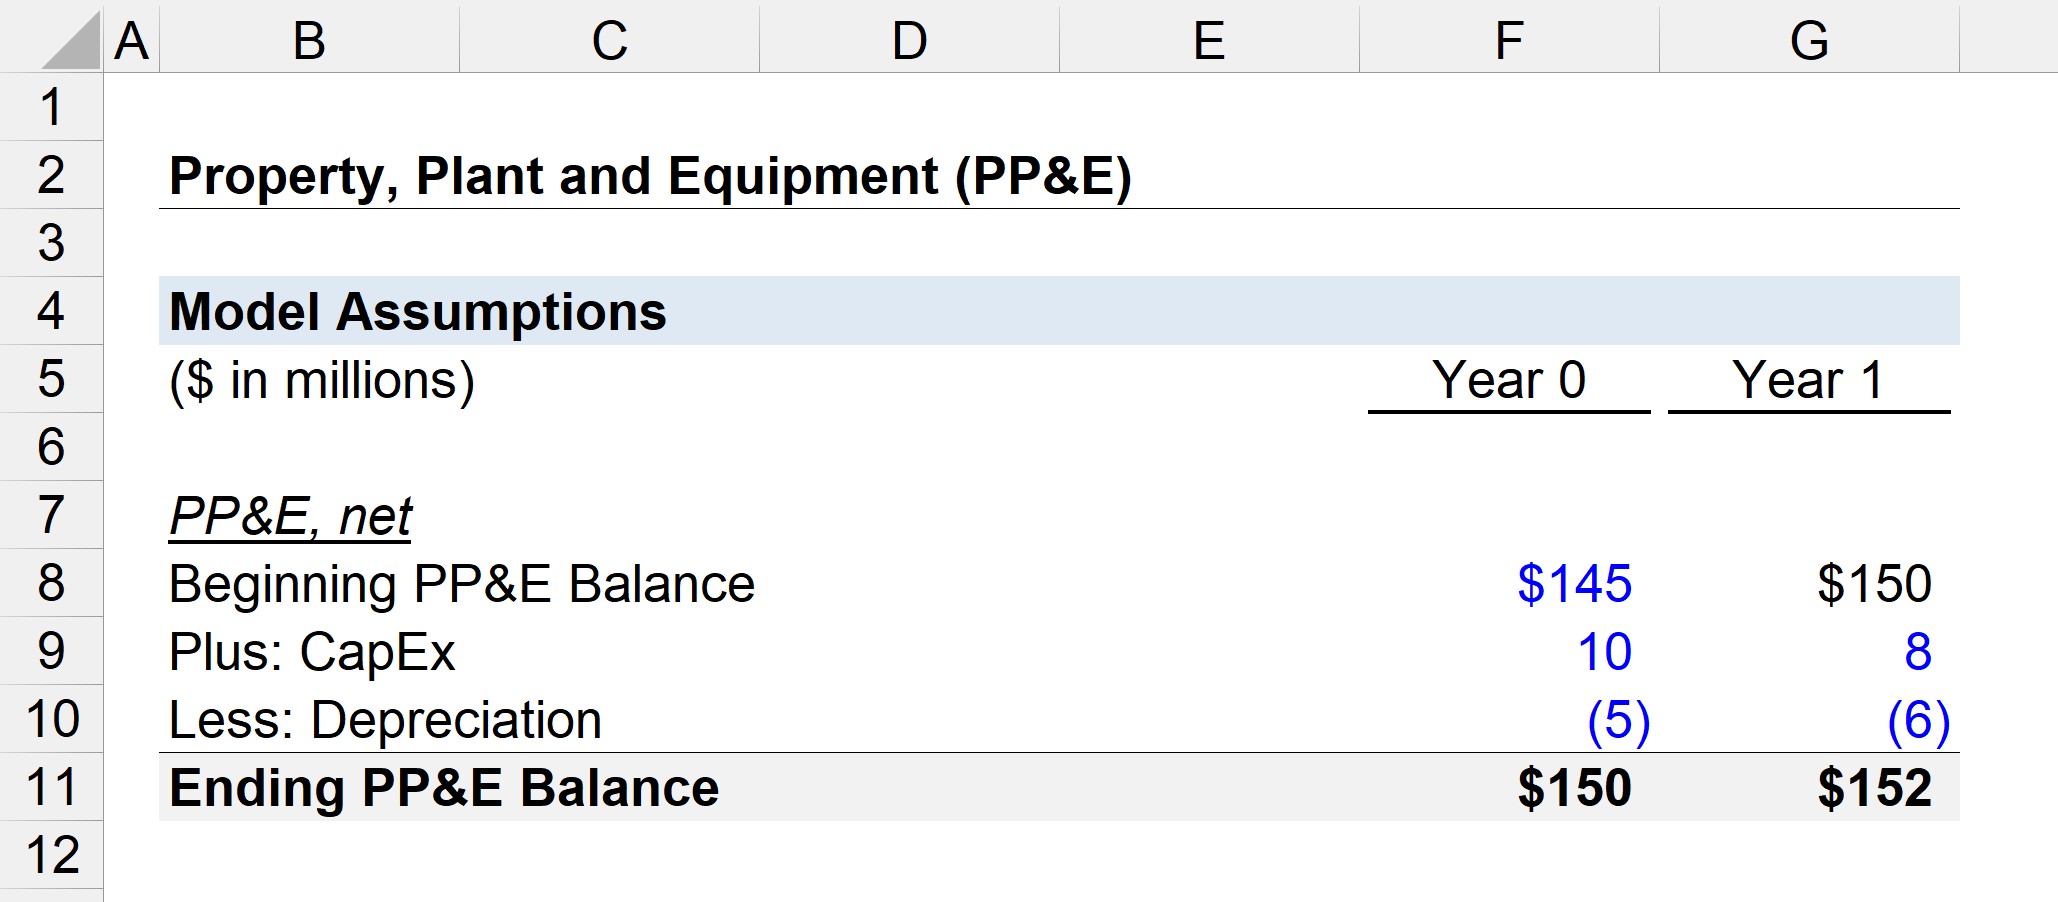
Suppose a company’s PP&E balance at the beginning of Year 0 is $145 million.
In Year 0, the company spent $10 million in capital expenditures (Capex) and incurred $5 million in depreciation.
- Beginning PP&E Balance = $145 million
- Capex = $10 million
- Depreciation = $5 million
Therefore, from $145 million, we add the $10 million in new PP&E purchases and then subtract the $5 million in depreciation expense.
The ending PP&E, net balance in Year 0 amounts to $150 million, as shown by the equation below.
- Year 0 Ending PP&E = $145 million + $10 million – $5 million = $150 million
In the next period, Year 1, we will assume that the company’s Capex spending declined to $8 million whereas the depreciation expense increased to $6 million.
Like all roll-forward schedules in the financial models, we’ll link the beginning PP&E balance in Year 1 to the ending balance in Year 0.
- Beginning PP&E Balance = $150 million
- Capex = $8 million
- Depreciation = $6 million
The ratio between Capex and depreciation typically converges towards 100% as a company matures.
The potential long-term investments decline over time and the proportion of capex becomes comprised of mostly maintenance Capex as opposed to growth Capex.
If we add the $8 million in Capex and subtract the $6 million in depreciation from the beginning PP&E of $150 million, we arrive at $152 million for the ending PP&E balance in Year 1.
- Year 1 Ending PP&E = $150 million + $8 million – $6 million = $152 million
In closing, the $152 million in PP&E is the carrying value recorded on the balance sheet of the company for the current period.

Everything You Need To Master Financial Modeling
Enroll in The Premium Package: Learn Financial Statement Modeling, DCF, M&A, LBO and Comps. The same training program used at top investment banks.
Enroll Today


