
What is Sharpe Ratio?
The Sharpe Ratio is the risk-adjusted return of a portfolio measured by dividing the excess return by the standard deviation of the portfolio.
How to Calculate Sharpe Ratio
The Sharpe ratio evaluates the risk-adjusted performance of an investment portfolio by determining the excess return received for the extra risk/volatility associated with a riskier portfolio.
Economist William Sharpe came up with the Sharpe ratio as well as the CAPM model.
Investors can determine the risk-adjusted returns by assessing the excess returns earned over the risk-free rate.
A core principle of valuation theory is that investors should receive more compensation for the incremental risk of holding a risky asset, rather than a risk-free asset.
If not, the investor has made an irrational choice, as the same return could have been obtained without the added risk.
The steps to calculate the Sharpe ratio are as follows:
- Step 1 → First, the formula starts by subtracting the risk-free rate from the portfolio return to isolate the excess return.
- Step 2 → Next, the excess return is divided by the portfolio’s standard deviation (i.e. the proxy for portfolio risk).
Sharpe Ratio Formula
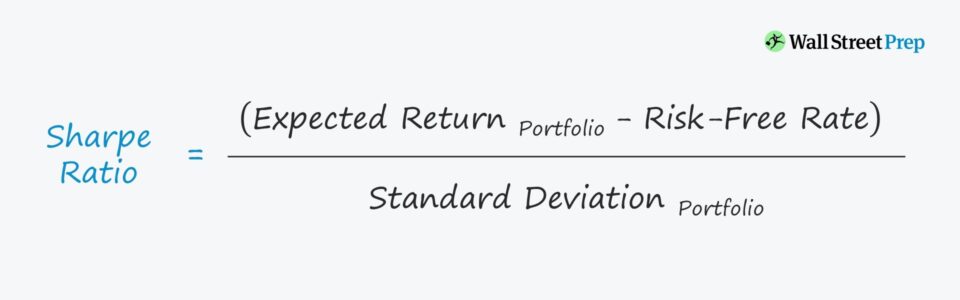
If we put the steps from the prior section together, the formula for calculating the ratio is the difference between the expected portfolio return and risk-free rate, divided by the standard deviation of the portfolio.
Where:
- Rp = Expected Portfolio Return
- Rf = Risk-Free Rate
- σp = Standard Deviation of Portfolio (Risk)
The Wharton Online & Wall Street Prep Applied Value Investing Certificate Program
Learn how institutional investors identify high-potential undervalued stocks. Enrollment is open for the upcoming cohort.
Enroll TodayWhat is a Good Sharpe Ratio?
Since the formula adjusts a portfolio’s historical or future performance for the excess risk taken on, a higher ratio is preferred when comparing across portfolios.
General Rules of Thumb
- Sharpe Ratio < 1.0x → Sub-Par Portfolio Return
- Sharpe Ratio > 1.0x Acceptable Portfolio Return
- Sharpe Ratio > 2.0x → Strong Portfolio Returns
- Sharpe Ratio > 3.0x+ → Exceptional Risk-Adjusted Returns
Broadly put, the Sharpe ratio is used to assess the risk-return of a portfolio or an individual investment – however, most use it for a basket of investments (e.g. mutual funds).
More specifically, the Sharpe ratio helps when comparing performance among portfolios, especially when it comes to the selection of mutual funds.
Yet, in practice, the Sharpe ratio is most commonly referenced in academia and among everyday retail investors because of its relative simplicity and ease of calculation.
Sharpe Ratio Calculator
We’ll now move to a modeling exercise, which you can access by filling out the form below.
Sharpe Ratio Calculation Example
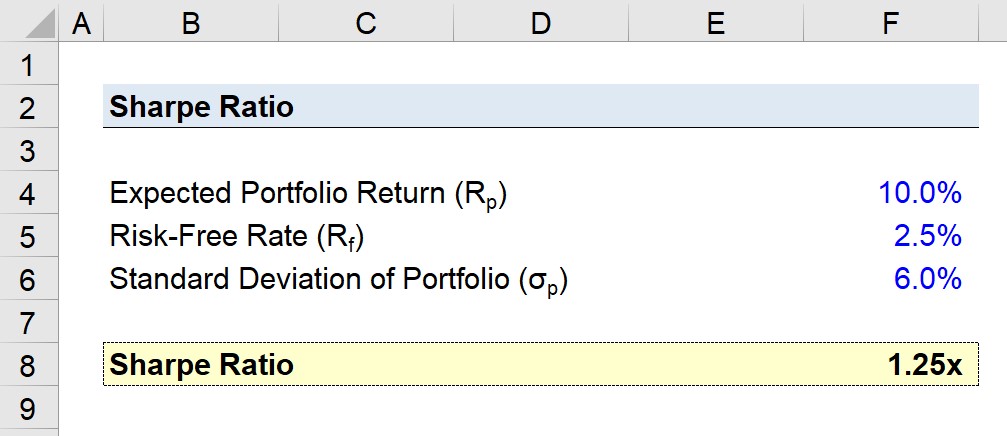
Suppose a portfolio has an expected return of 10.0% and a standard deviation of 6.0%.
- Expected Portfolio Return (Rp) = 10.0%
- Risk-Free Rate (Rf) = 2.5%
- Standard Deviation of Portfolio (σp) = 6.0%
If the risk-free rate is currently at 2.5%, the Sharpe ratio equals 1.25x.
- Sharpe Ratio = (10% – 2.5%) ÷ 6.0% = 1.25x
Sharpe Ratio vs. Sortino Ratio: What is the Difference?
The most frequent critique of the Sharpe ratio is how the standard deviation of the portfolio is used as the proxy for risk.
Certain academics and practitioners argue that this is an oversimplified assumption since it implies portfolio returns fall on a normal distribution.
Hence, many variations have emerged to account for portfolio risk in different ways, such as the Sortino ratio.
One example that emerged to address that risk component is referred to as the Sortino ratio, which uses downside deviation as the risk measure, as opposed to the standard deviation of the portfolio’s returns.
The Sortino ratio also uses the required rate of return instead of the risk-free rate, so the numerator consists of the portfolio return minus the required return.


