What is Sortino Ratio?
The Sortino Ratio is a variation of the Sharpe ratio used to measure the risk-adjusted return on a portfolio that compares performance relative to the downside deviation, rather than the overall standard deviation, of a portfolio’s returns.
The Sortino ratio is calculated by determining the return of a portfolio, subtracting the risk-free rate (rf), and dividing the resulting figure by the implied downside deviation on the investment.
How to Calculate Sortino Ratio
The Sortino ratio is a metric that evaluates the return on an investment or portfolio compared to the risk-free rate, similar to the Sharpe ratio.
In fact, the Sortino ratio is a modified variation of the Sharpe ratio, whereby the adjustments applied in the calculation are intended to address its shortcomings.
But to calculate the Sortino ratio, only the downside deviations — i.e. the negative movements in market prices — are factored into the ratio.
The basis of the Sortino ratio is that not all volatility is necessarily bad. Hence, only the downside risk is measured in the calculation.
The Sortino ratio comprises three inputs:
- Portfolio Return (rp) → The return on a portfolio, either on a historical basis (i.e. actual results) or the expected returns according to the portfolio manager.
- Risk-Free Rate (rf) → The risk-free rate is the return received on default-free securities, e.g. U.S. government bond issuances.
- Downside Standard Deviation (σd) → The standard deviation of solely the investment’s or portfolio’s negative returns, i.e. the downside deviation.
For the most part, the primary use-case of the ratio is for evaluating the performance of portfolio managers, or more specifically, to compare performance across funds.
Sortino Ratio Formula
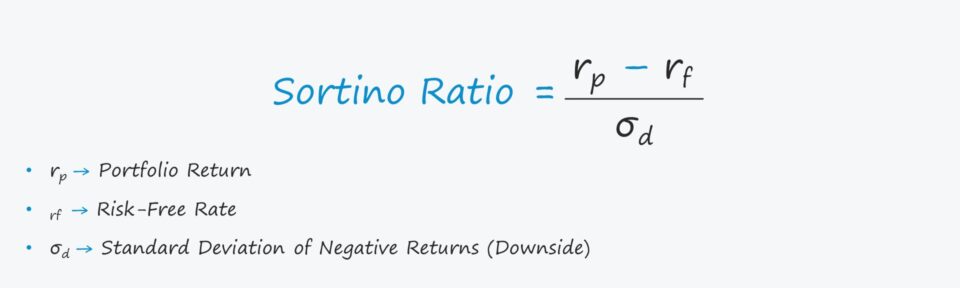
The formula for calculating the Sortino ratio is as follows.
Where:
- rp = Portfolio Return
- rf = Risk-Free Rate
- σd = Downside Deviation
While the portfolio return could be calculated on a forward basis, most investors and academics place more weight on actual, historical results, as opposed to a fund’s hypothetical target returns.
Considering how unpredictable the markets are, the expected returns would only be credible if supported by historical results, so the two approaches are closely tied to each other, regardless.
The Wharton Online & Wall Street Prep Applied Value Investing Certificate Program
Learn how institutional investors identify high-potential undervalued stocks. Enrollment is open for the upcoming cohort.
Enroll TodayWhat is a Good Sortino Ratio?
The higher the Sortino ratio, the greater the expected risk-adjusted returns — all else being equal.
A higher Sortino ratio signifies a higher return per unit of downside risk, while a lower ratio indicates lower returns per unit of negative risk.
In accordance with the trade-off theory, the minimum rate of return (or “hurdle rate”) required by investors should increase the greater the level of risk.
Therefore, a higher Sortino ratio must result in more returns to compensate investors for the incremental risk (and vice versa).
However, since the ratio is calculated using past data, it is still a flawed indicator of future performance.
Sortino Ratio vs. Sharpe Ratio: What is the Difference?
One common critique of the Sharpe ratio is how the standard deviation of a portfolio’s returns represents the portfolio risk.
In short, the notion that all equity returns follow a normal distribution is an oversimplified assumption — which is the reason for numerous variations of the Sharpe ratio such as the Sortino ratio.
In the case of the Sortino ratio, the downside deviation replaces the standard deviation of the total portfolio’s returns.
On that note, the Sharpe ratio tends to be more applicable for portfolios exhibiting low volatility, while the Sortino ratio is more practical for portfolios with high volatility.
With that said, the Sortino ratio is used frequently by returns-oriented investors in the financial markets that pursue higher returns in excess of the broader market (and thereby use riskier strategies).
Sortino Ratio Calculator
We’ll now move to a modeling exercise, which you can access by filling out the form below.
Sortino Ratio Calculation Example
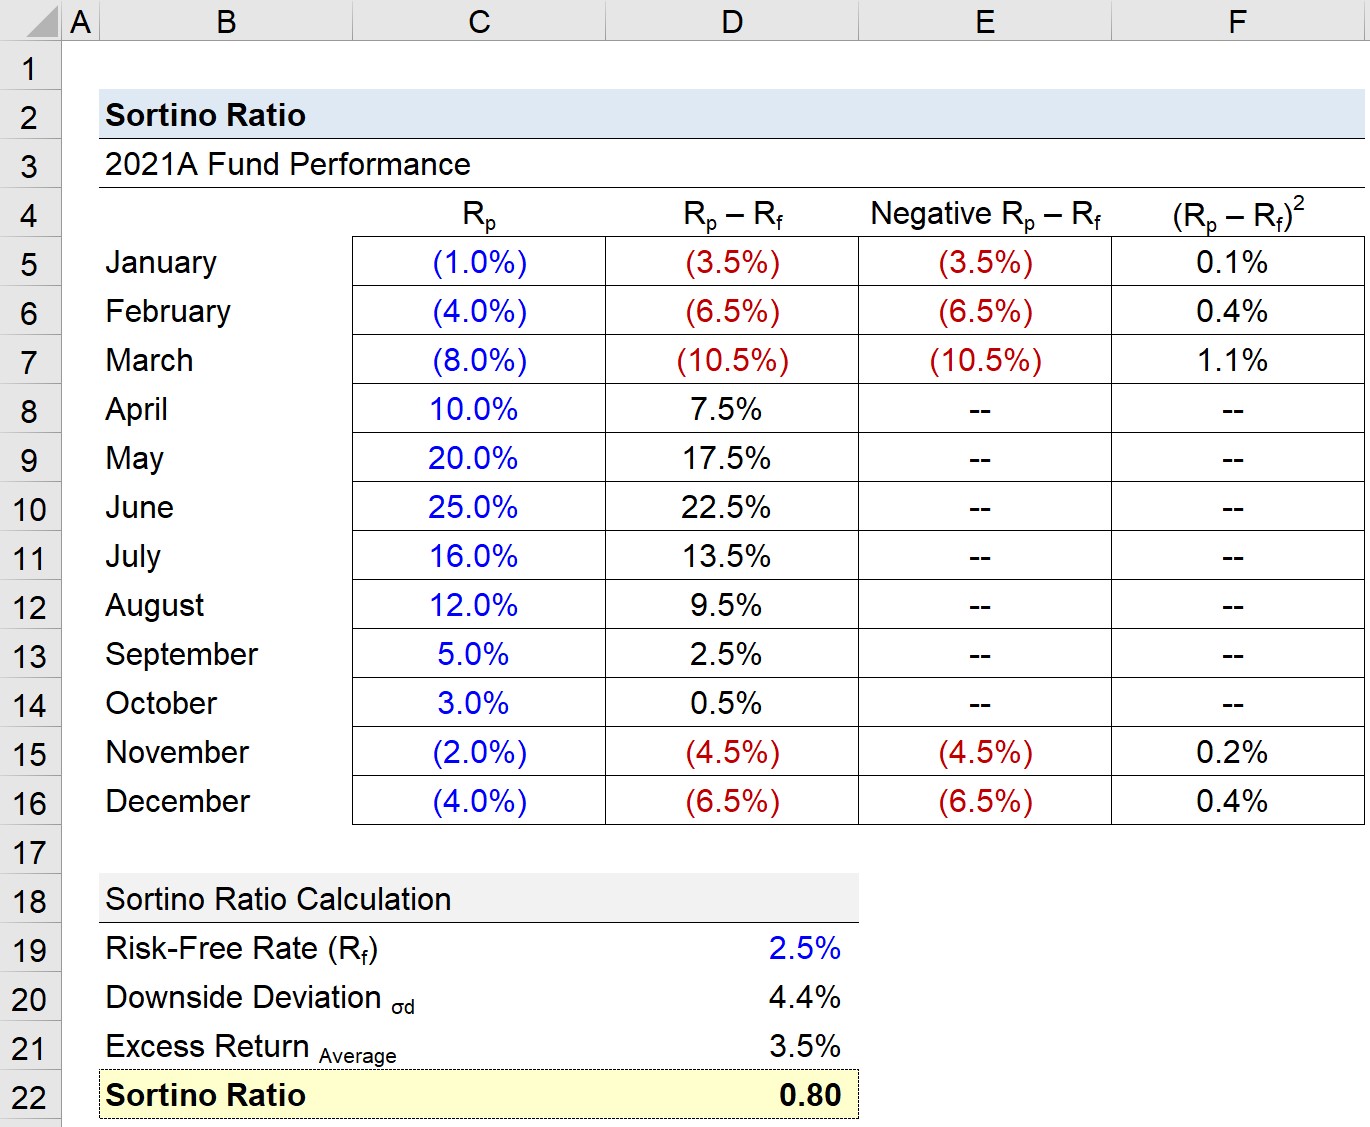
Suppose the portfolio of a hedge fund had the following performance in returns for 2021.
2021 Hedge Fund Portfolio Performance
- January = (1.0%)
- February = (4.0%)
- March = (8.0%)
- April = 10.0%
- May = 20.0%
- June = 25.0%
- July = 16.0%
- August = 12.0%
- September = 5.0%
- October = 3.0%
- November = (2.0%)
- December = (4.0%)
Given the monthly returns data, we can compare the portfolio returns to the risk-free rate, which we’ll assume to be 2.5%.
- Risk-Free Rate (rf) = 2.5%
If we subtract the risk-free rate from the portfolio return for each month, we are left with the excess return in each month.
But the Sortino ratio focuses solely on the downside deviation, so in the formula for the next column, we will insert an “IF” function where only the negative monthly returns appear (i.e. positive excess returns will result in an output of 0).
The five months in which the returns were negative are 1) January, 2) February, 3) March, 4) November, and 5) December – reflecting how losses were concentrated on the beginning and end of the year.
In the next column, we’ll calculate the square of the negative returns, which will be used in the downside standard deviation formula.
To calculate the downside deviation, we’ll add up the column we just completed and use the “SQRT” function on the sum, which is subsequently divided by the total number of months.
- Downside Deviation (σd) = 4.4%
The next step is calculating the average excess return across the entire period.
- Excess Returns, Average = 3.5%
Upon dividing the average excess returns of 3.5% by the downside deviation of 4.4%, we arrive at a Sortino ratio of 0.80.
- Sortino Ratio = 3.5% ÷ 4.4% = 0.80