 Skip to main content
- What is Vertical Analysis?
- How to Perform Vertical Analysis
- Common Size Analysis of Financial Statements
- Vertical Analysis Formula
- Vertical Analysis Calculator
- Step 1. Historical Income Statement and Balance Sheet Data
- Step 2. Vertical Analysis of Income Statement
- Step 3. Vertical Analysis of Balance Sheet
What is Vertical Analysis?
Vertical Analysis is a form of financial analysis where the line items on a company’s income statement or balance sheet is expressed as a percentage of a base figure.
How to Perform Vertical Analysis
Conceptually, vertical analysis can be thought of as reading a single column of financial data and determining the relationships among each item to reflect the relative size of the various cost and profit metrics.
The standard base figures for the income statement and balance sheet are as follows.
- Income Statement → The base figure for the income statement is most often revenue, or sales (i.e. the “top line”), so each expense and profitability metric is expressed as a percentage of revenue. A less common base metric for the income statement, yet still informative, is the total operating expenses line item, which can be used to assess the percentage breakdown of a company’s operating expenses (e.g. research and development, selling, general and administrative)
- Balance Sheet → On the other hand, the base figure for the balance sheet is usually the “Total Assets” line item for all sections, although “Total Liabilities” can also be used. Note that by dividing a company’s liabilities and equity line items by total assets, you’re essentially dividing by the sum of those two sections because of the accounting equation (i.e. Assets = Liabilities + Shareholders Equity).
Common Size Analysis of Financial Statements
Performing vertical analysis creates the so-called “common size” income statement and the “common size” balance sheet.
The common size financials are denoted in percentage terms, which facilitates direct comparisons between the target company and its peer group of comparable companies, such as competitors operating in the same or an adjacent industry (i.e. an “apples-to-apples” comparison).
Unlike the unadjusted income statement and balance sheet, the common size variations can be used for peer-to-peer comparisons between different companies.
Vertical Analysis Formula
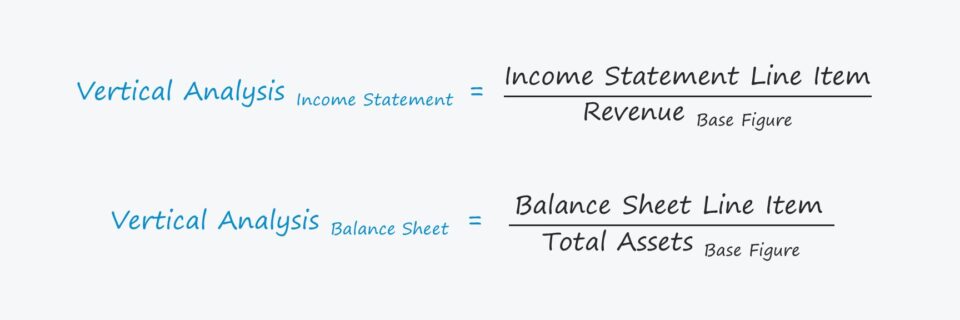
Starting from the revenue line item, each line item on the income statement – if deemed appropriate – is divided by revenue (or the applicable core metric).
The formula to perform vertical analysis on the income statement, assuming the base figure is revenue, is as follows.
In contrast, the process is practically the same for the balance sheet, but there is the added option of using “Total Liabilities” instead of “Total Assets”. But we’ll utilize the latter here, as that tends to be the more prevalent approach taken.
Vertical Analysis Calculator
We’ll now move to a modeling exercise, which you can access by filling out the form below.
Step 1. Historical Income Statement and Balance Sheet Data
Suppose we’ve been tasked with performing vertical analysis on a company’s financial performance in its latest fiscal year, 2021.
To start, the table below shows the company’s historical financial statements – the income statement and balance sheet – of our hypothetical company, which we’ll be using throughout our two-part exercise.
| Historical Income Statement | 2021A |
|---|---|
| Revenue | $200 million |
| Less: COGS | (120) million |
| Gross Profit | $80 million |
| Less: SG&A | (25) million |
| Less: R&D | (10) million |
| EBIT | $45 million |
| Less: Interest Expense | (5) million |
| EBT | $40 million |
| Less: Taxes (30%) | (12) million |
| Net Income | $28 million |
| Historical Balance Sheet | 2021A |
|---|---|
| Cash and Equivalents | $100 million |
| Accounts Receivable | 50 million |
| Inventory | 80 million |
| Prepaid Expenses | 20 million |
| Total Current Assets | $250 million |
| PP&E, net | 250 million |
| Total Assets | $500 million |
| Accounts Payable | $65 million |
| Accrued Expenses | 30 million |
| Total Current Liabilities | $95 million |
| Long-Term Debt | 85 million |
| Total Liabilities | $180 million |
| Total Equity | $320 million |
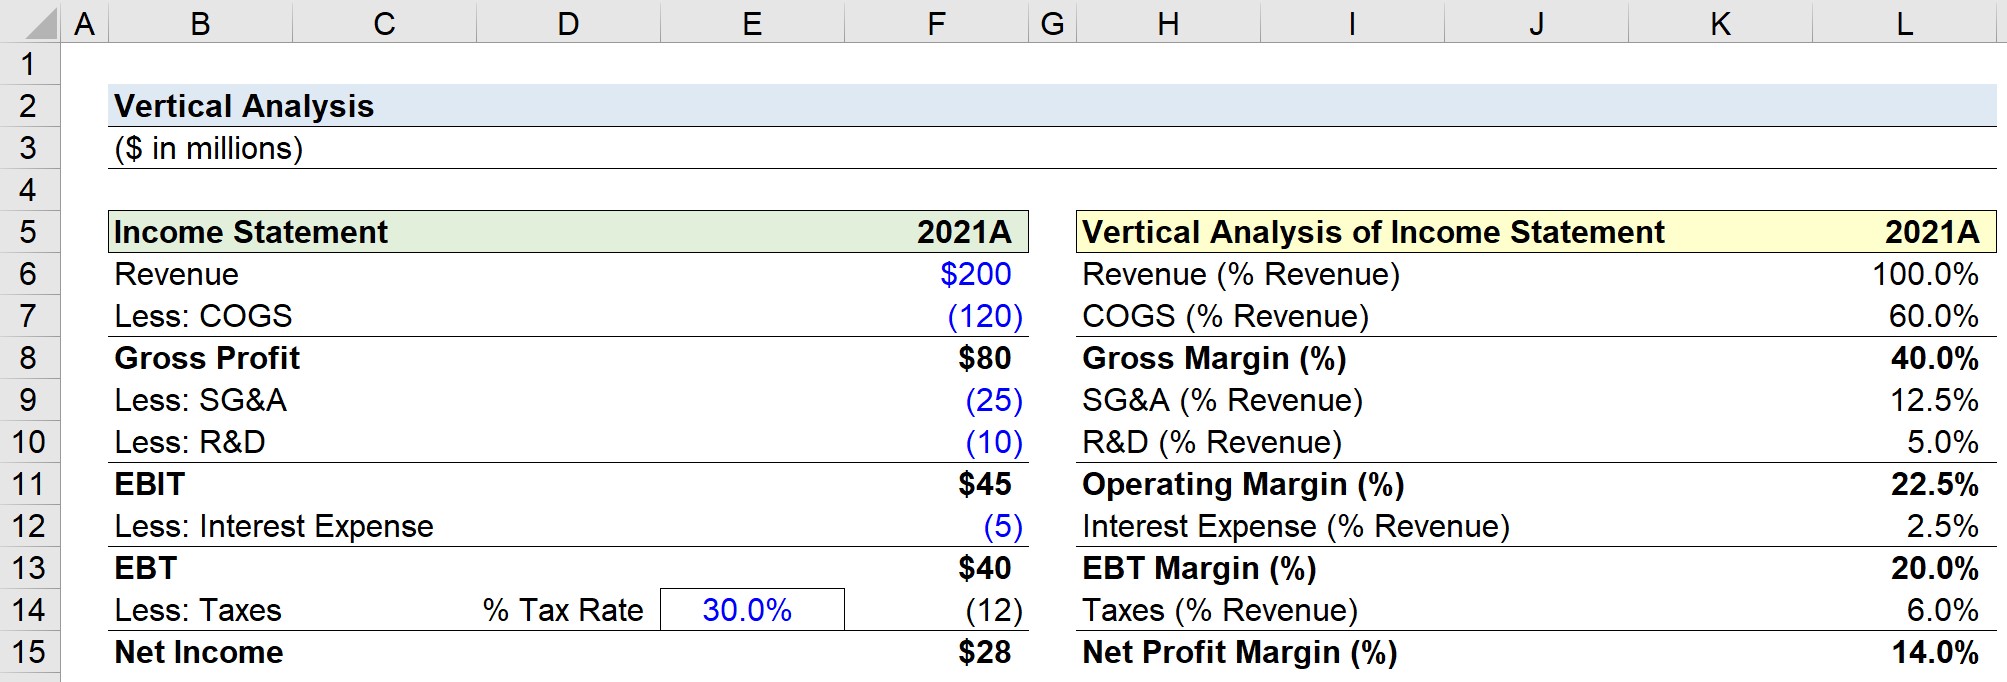
Once the historical data from 2021 has been inputted into Excel, we must determine the base figure to use.
Here, we’ve chosen “Revenue” as the base figure for the common size income statement, followed by “Total Assets” for the common size balance sheet.
Step 2. Vertical Analysis of Income Statement
Percentage of Revenue Calculation Example
With our financial data presented in Excel, we can start to calculate the contribution percentages on either the side or below the income statement.
Regardless of the placement, the more important factor is to ensure the analysis clearly shows which period it is reflecting.
The placement is not much of a concern in our simple exercise, however, the analysis can become rather “crowded” given numerous periods.
So if we had multiple years of historical data, it is recommended to organize the percentage calculations into a single section on the far right or below the financials with the timing of the periods aligned.
In order to keep a complex model more dynamic and intuitive to the reader(s), it is generally a “best practice” to avoid creating separate columns in between each period.
Further, when working with large data sets, we recommend cleaning up the data to improve the overall visual representation of the analysis.
For example, some minor adjustments could be to remove the “Revenue (% Revenue)” line item since it is not necessary and offers no practical insights.
For each line item, we’ll divide the amount by the corresponding period’s revenue to arrive at our contribution percentages.
Because we entered our costs and expenses as negatives, i.e. to reflect that those items are cash outflows, we must place a negative sign in front when applicable, so that the percentage shown is a positive figure.
Of the takeaways from our common size income statement, the most important metrics are the following:
- Gross Margin (%) = 40.0%
- Operating Margin (%) = 22.5%
- EBT Margin (%) = 20.0%
- Net Profit Margin (%) = 14.0%
| Vertical Analysis of Income Statement | 2021A |
|---|---|
| Revenue (% Revenue) | 100.0% |
| COGS (% Revenue) | (60.0%) |
| Gross Margin (%) | 40.0% |
| SG&A (% Revenue) | (12.5%) |
| R&D (% Revenue) | (5.0%) |
| Operating Margin (%) | 22.5% |
| Interest Expense (% Revenue) | (2.5%) |
| EBT Margin (%) | 20.0% |
| Taxes (% Revenue) | (6.0%) |
| Net Profit Margin (%) | 14.0% |
Step 3. Vertical Analysis of Balance Sheet
Percentage of Total Assets Calculation Example
We’ve now completed our vertical analysis for our company’s income statement and will move on to the balance sheet.
The process is virtually identical to our common size income statement, however, the base figure is “Total Assets” as opposed to “Revenue”.
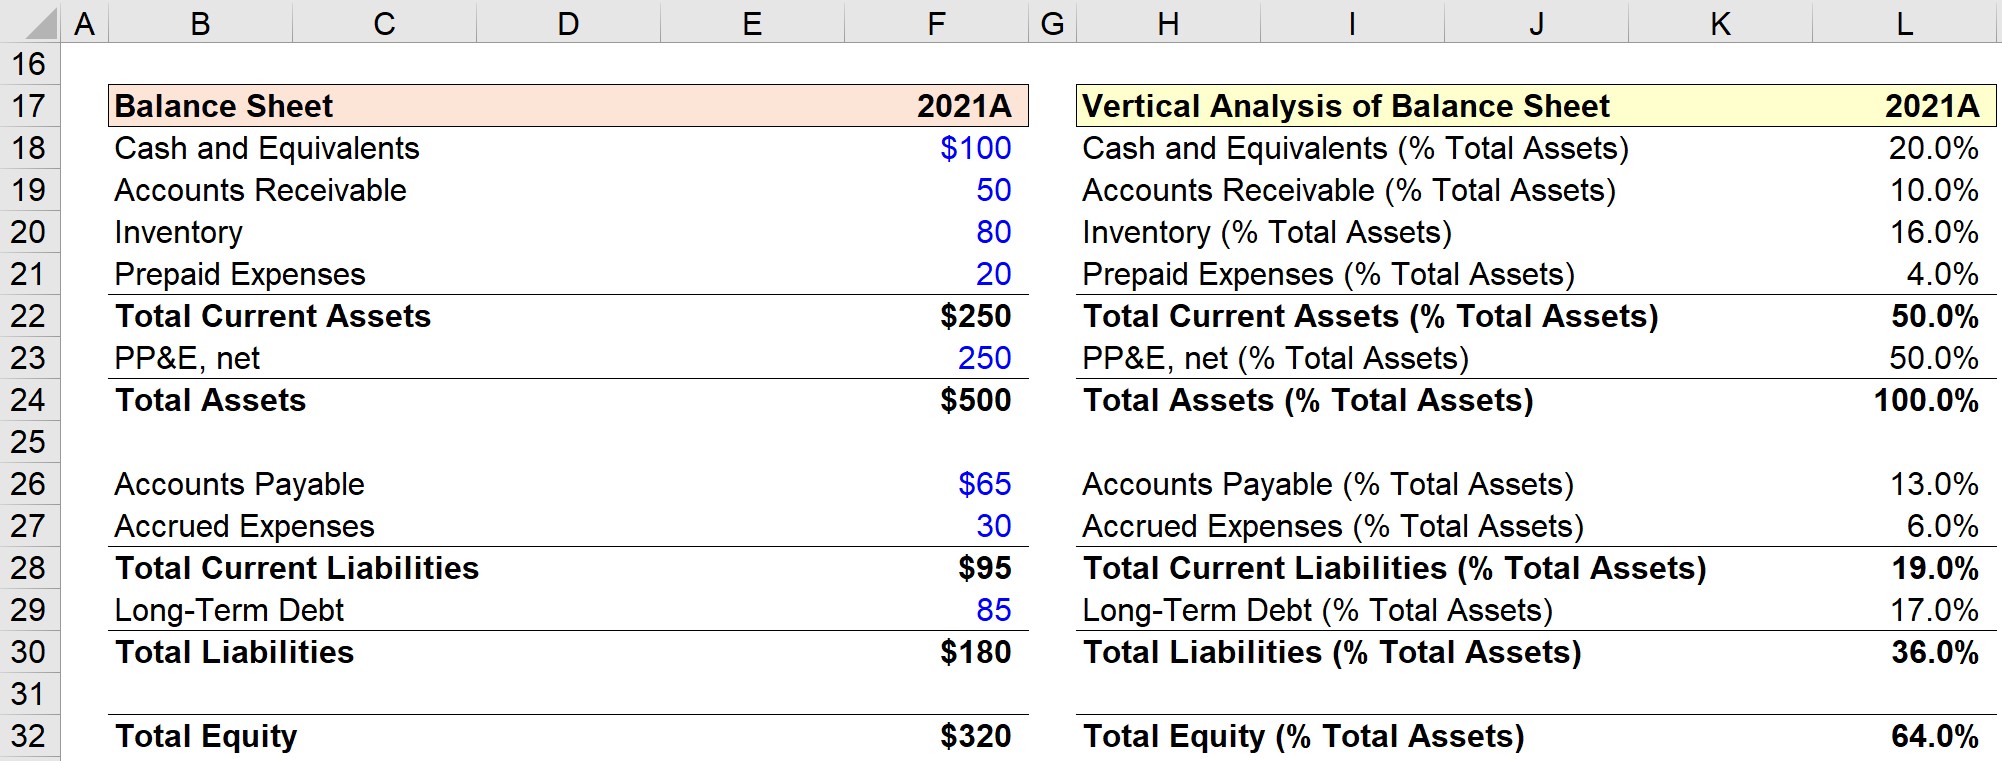
Once we divide each balance sheet item by the “Total Assets” of $500 million, we are left with the following table.
The assets section is informative with regard to understanding which assets belonging to the company constitute the greatest percentage.
In our case, half of the company’s asset base comprises PP&E, with the rest coming from its current assets.
- Cash and Equivalents = 20.0%
- Accounts Receivable = 10.0%
- Inventory = 16.0%
- Prepaid Expenses = 4.0%
The sum of the current assets equals 50%, confirming our calculations thus far are correct.
On the liabilities and shareholders equity side, we’ve chosen the base figure to be total assets.
To reiterate from earlier, dividing by total assets is akin to dividing by the sum of liabilities and equity.
Since liabilities and equity represent a company’s funding sources – i.e. how the company obtained the funds to purchase its assets – this part of the analysis can be insightful for understanding where the company’s financing stems from.
For instance, we can see that our company’s long-term debt as a percentage of total assets is 17.0%. The metric we calculated is formally known as the “debt to asset ratio”, which is a ratio used to gauge a company’s solvency risk and the proportion of its resources (i.e. assets) funded by debt rather than equity.
| Vertical Analysis of Balance Sheet | 2021A |
|---|---|
| Cash and Equivalents (% Total Assets) | 20.0% |
| Accounts Receivable (% Total Assets) | 10.0% |
| Inventory (% Total Assets) | 16.0% |
| Prepaid Expenses (% Total Assets) | 4.0% |
| Total Current Assets (% Total Assets) | 50.0% |
| PP&E, net (% Total Assets) | 50.0% |
| Total Assets (% Total Assets) | 100.0% |
| Accounts Payable (% Total Assets) | 13.0% |
| Accrued Expenses (% Total Assets) | 6.0% |
| Total Current Liabilities (% Total Assets) | 19.0% |
| Long-Term Debt (% Total Assets) | 17.0% |
| Total Liabilities (% Total Assets) | 36.0% |
| Total Equity (% Total Assets) | 64.0% |

Everything You Need To Master Financial Modeling
Enroll in The Premium Package: Learn Financial Statement Modeling, DCF, M&A, LBO and Comps. The same training program used at top investment banks.
Enroll Today


