 Skip to main content
What is NOPAT Margin?
The NOPAT Margin is a profitability ratio that compares a company’s net operating profit after tax to revenue, expressed in percentage form.
How to Calculate NOPAT Margin
The NOPAT margin (%) is the ratio between a company’s net operating profit after tax (NOPAT) and revenue.
- NOPAT → NOPAT stands for “Net Operating Profit After Tax” and represents the hypothetical operating income of a company if its capital structure was all-equity, i.e. contains no debt financing.
- Revenue → Net revenue, or “net sales”, is the total monetary value earned by a company from selling goods or services in a specified period, upon adjusting for returns, discounts, and sales allowances.
Since NOPAT, or “EBIAT”, is a company’s operating income after the removal of discretionary and non-operating items such as financing, NOPAT represents all capital providers, including debt lenders and common equity shareholders.
NOPAT is a critical component in building a DCF model, as it is the starting point of forecasting a company’s free cash flow to firm (FCFF), or unlevered free cash flow. Furthermore, the objective of an unlevered DCF is to arrive at an implied enterprise value (TEV), which is the value of a company’s operations to all stakeholders.
- Capital Structure Neutral → The recurring theme is that NOPAT, FCFF, and enterprise value are all capital-structure neutral, i.e. all capital provider groups are represented. The inherent assumption in the NOPAT calculation is that there is no debt on the company’s capital structure, so there is no interest expense (and thus, no tax savings from the “interest tax shield”). Therefore, NOPAT facilitates more “apples-to-apples” comparisons among industry peers, as the effects of discretionary decisions are removed (and neither interest expense nor non-recurring items skew the metric).
- Core, Recurring Operating Performance → The forecasted free cash flow to firm (FCFF) must be “normalized” to reflect only the core operating performance of a company; hence, the use of NOPAT in the FCFF formula. For example, interest expense is a financing item, instead of an operating item, and the cash outflow pertains to a single capital provider group, i.e. the debt lender.
Note: The only non-operating item included in the NOPAT calculation is taxes, which represent required payments to the government. However, the tax expense is based on EBIT, as opposed to the company’s reported pre-tax income (EBT).
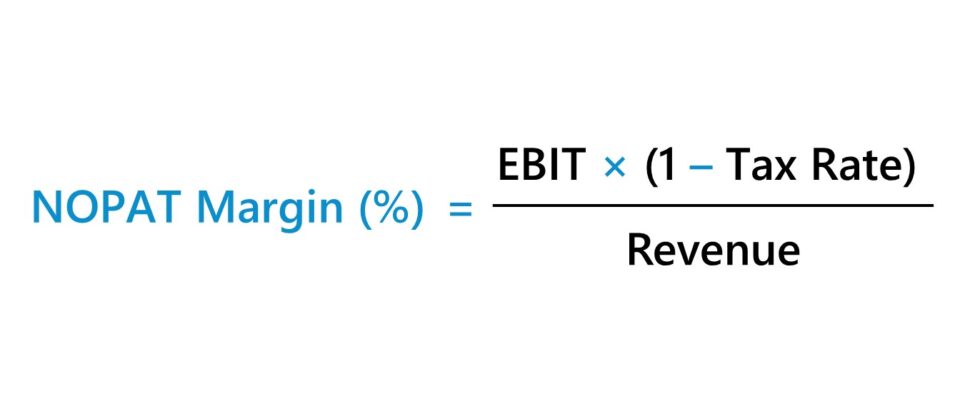
NOPAT Margin Formula
The NOPAT margin formula is as follows.
The numerator, NOPAT, is calculated using the following formula:
NOPAT Margin Calculator
We’ll now move on to a modeling exercise, which you can access by filling out the form below.
1. Operating Assumptions
Suppose you’re tasked with calculating the NOPAT margin of a company as of its latest reporting period.
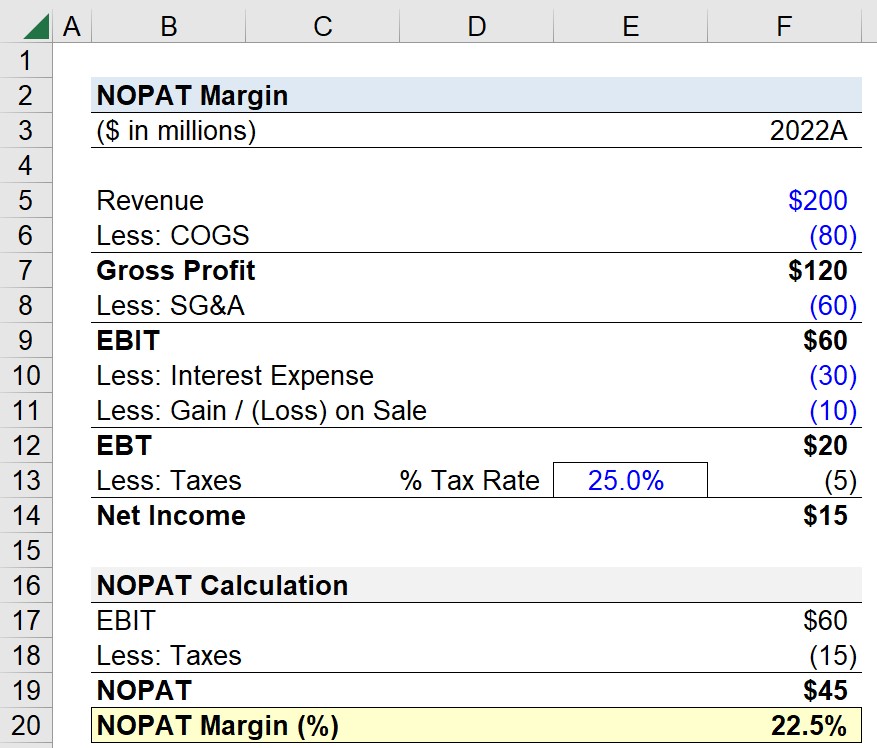
The following is the company’s income statement data for the fiscal year ending 2022.
| Income Statement | 2022A |
|---|---|
| Revenue | $200 million |
| Less: COGS | (80 million) |
| Gross Profit | $120 million |
| Less: SG&A | (60 million) |
| EBIT | $60 million |
| Less: Interest Expense | (30 million) |
| Less: Gain / (Loss) on Sale | (10 million) |
| EBT | $20 million |
| Less: Taxes @ 25.0% | (5 million) |
| Net Income | $15 million |
To calculate NOPAT, we’ll start with EBIT ($60 million) and multiply it by our tax rate (25%) to determine our normalized tax amount.
- EBIT = $60 million
- Adjusted Taxes = $60 million × 25% = $15 million
With the value of those two inputs determined, we can deduct the adjusted taxes from EBIT to arrive at a NOPAT of $45 million.
- NOPAT = $60 million – $15 million = $45 million
Conversely, we could have multiplied NOPAT by (1 – Tax Rate %), which returns the same value.
- NOPAT = $60 million × (1 – 25%) = $45 million
2. NOPAT Margin Calculation Example
Because we calculated the adjusted tax separately in the prior step, the tax expense recorded on the income statement can be compared to our NOPAT calculation.
The taxes paid per our income statement were $5 million, while the adjusted tax expense is $15 million. The $10 million difference is attributable to the fact that the company incurred $30 million in interest expense and a loss on an asset sale of $10 million, which created tax shields.
Thus, the $40 million in interest expense and the non-operating loss contributed to tax savings that are not indicative of the company’s core, recurring operations (and should be excluded for purposes of performing a comps analysis or DCF analysis).
In conclusion, we’ll divide our company’s NOPAT ($45 million) in 2022 by the corresponding revenue amount ($200 million) to calculate the NOPAT margin, which comes out to be 22.5%.
- NOPAT Margin (%) = $45 million ÷ $200 million = 22.5%

Everything You Need To Master Financial Modeling
Enroll in The Premium Package: Learn Financial Statement Modeling, DCF, M&A, LBO and Comps. The same training program used at top investment banks.
Enroll Today


