 Skip to main content
What is the Net Profit Ratio?
The Net Profit Ratio is a financial metric that measures the after-tax profitability of a company relative to its revenue generated in the corresponding period.
The net profit ratio compares a company’s reported net income (the “bottom line”) to its revenue in the same period, expressed in the form of a percentage.
How to Calculate Net Profit Ratio?
The net profit ratio is a measure of profitability where the post-tax net earnings of a company are expressed as a proportion of its total revenue. The profitability ratio is frequently used interchangeably with the term “net profit margin” or “net margin” for short.
Simply put, the net profit ratio offers insights into a company’s ability to continue generating profits after deducting its operating and non-operating costs.
- Operating Costs → Cost of Goods Sold (COGS), Selling, General and Administrative (SG&A), and Research and Development (R&D)
- Non-Operating Costs → Interest Expense, Inventory Write-Downs, Goodwill Impairment, Income Taxes
Since net income represents the residual profits remaining after all operating and non-operating costs are subtracted, the profit metric is considered to be the most comprehensive profit metric.
Why? Each cost and expense incurred by the company, irrespective of whether the spending pertains to the core operating activities of the business, are included in the computation of the metric.
Of course, net income is an imperfect method to determine the profitability of a company because it is affected by discretionary decisions (e.g., capital structure), non-cash items (e.g., depreciation and amortization, “D&A”), and non-recurring items.
Hence, the practical use case of the net profit ratio is to track the historical trajectory of a company’s profitability rather than for the sake of comparability to industry peers.
The step-by-step process to calculate the net profit ratio is as follows.
- Calculate Net Income (EBT – Taxes)
- Determine Revenue in the Coindiding Period
- Divide Net Income by Revenue
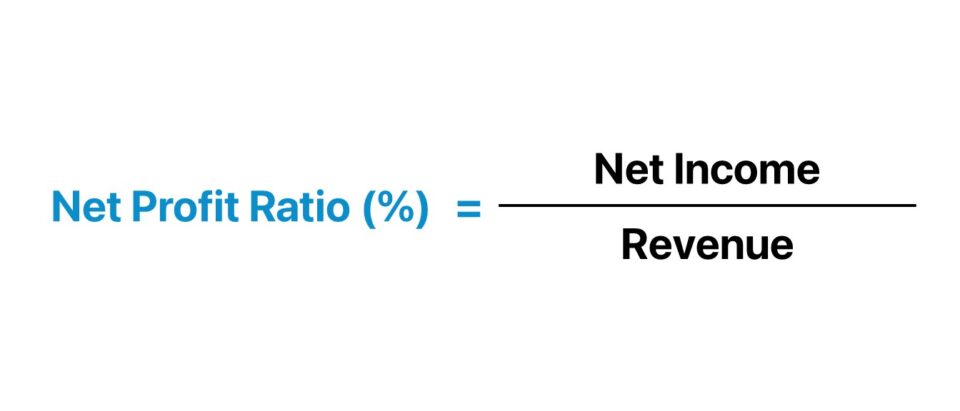
Net Profit Ratio Formula
The formula to calculate the net profit ratio is as follows.
The net income is the “bottom line” of the income statement, whereas revenue is the “top line” of the income statement.
In practice, the net profit ratio is widely used by equity analysts and investors to determine the margin profile of a particular company and its capacity to generate enough earnings to reinvest in itself and continue to operate for the foreseeable future
What is a Good Net Profit Ratio?
In short, a higher net profit ratio signifies that a company is likely to generate more profits in relation to its peers.
With that said, a lower net profit ratio implies the profit margins of the company are facing downward compression, reflected by lower profit margins – which is frequently perceived to be a “red flag” for near-term financial performance and a valid cause for concern.
The proportion of the company’s revenue in relation to its revenue metric is composed mostly of net income, or “net earnings.”
Generally, companies with higher net profit ratios can manage their costs and spending on products or goods to ensure there is enough income in the worst-case scenario costs. Consequently, a high net profit metric stems from the following factors:
- Operating Near-Optimal Efficiency
- Strategic Management Team
- Low Operating Expenses (Opex) and Capital Expenditures (Capex)
- Effective Pricing Tactics Based on Analyzing the Target End Market
On the other hand, a company exhibiting a lower net profit ratio suffers from the opposite problems as in the prior example:
- Inefficient Cost Structure
- Poor Pricing Tactics (Misalignment with Target Customer Base)
- Sub-Par Management Decisions
- Lack of Clarity on Ideal Customer Profile
The core issue contributing toward the declining net profit ratios tends to be management teams that easily become complacent with their past achievements and progress to date.
Sure, a celebration might be warranted, yet the tide can turn rather quickly – especially in competitive markets where the company can abruptly find itself placed in an unfavorable position, trailing behind its closest competitors.
Net Profit Ratio Calculator
We’ll now move to a modeling exercise, which you can access by filling out the form below.
Net Profit Ratio Calculation Example
Suppose we’re tasked with calculating the net profit ratio of a company for 2021 and 2022 using the following financial data.
| Income Statement Data | ||
|---|---|---|
| ($ in millions) | 2021A | 2022A |
| Net Revenue | $225 | $250 |
| (–) Cost of Goods Sold (COGS) | (125) | (125) |
| Gross Profit | $100 | $125 |
| (–) Research and Development (R&D) | (40) | (50) |
| (–) Selling, General and Administrative (SG&A) | (20) | (25) |
| Operating Profit (EBIT) | $40 | $50 |
| (–) Interest Expense, net | (10) | (10) |
| Pre-Tax Income (EBT) | $30 | $40 |
| (–) Income Taxes @ 25.0% Tax Rate | (8) | (10) |
| Net Income | $23 | $30 |
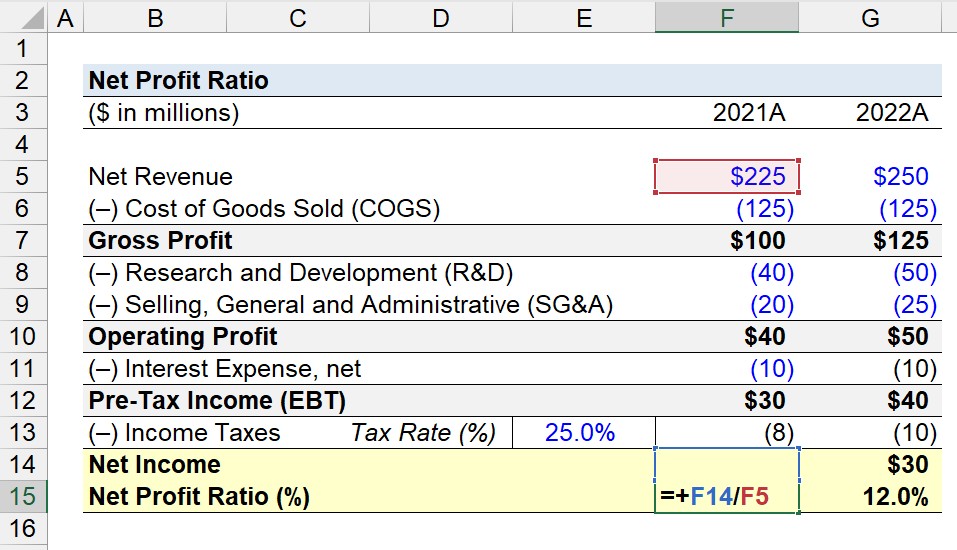
For each period, the net income is determined by subtracting COGS from net revenue, deducting operating expenses (R&D and SG&A) from gross profit, and adjusting operating profit (EBIT) by non-operating items, which is only interest expense in our hypothetical scenario.
Given the tax rate assumption of 25.0%, we’ll multiply the pre-tax income (EBT) for each year by 25.0% to determine the income tax expense, which reduces pre-tax income (EBT) to arrive at net income.
By dividing net income by revenue in the corresponding period, the net profit ratio comes out to be approximately 10.0% in 2021.
- Net Profit Ratio (%) – 2021A = $23 million ÷ $225 million = 10.0%
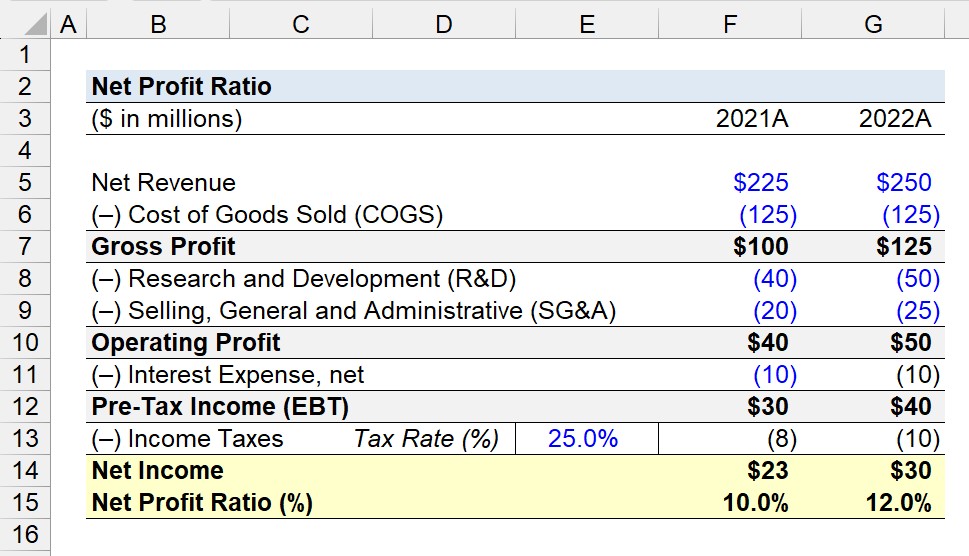
In the next step, we’ll repeat the process for the fiscal year ending 2022, where the net revenue is $250 million while the net income is $30 million.
- Net Profit Ratio (%) – 2022A = $30 million ÷ $250 million = 12.0%
In conclusion, the net profit ratio in 2022 is 12.0%, which compared to the prior period, reflects an increase of 2.0% year-over-year (YoY).

Everything You Need To Master Financial Modeling
Enroll in The Premium Package: Learn Financial Statement Modeling, DCF, M&A, LBO and Comps. The same training program used at top investment banks.
Enroll Today


