What is EPS Growth?
EPS Growth measures the rate at which a company’s earnings per share (EPS) is increasing or decreasing, expressed as a percentage.
How to Calculate EPS Growth
The EPS growth rate refers to the percentage change in a company’s net profitability on a per-share basis, i.e. the net income generated in a given period as allocated to each common share outstanding.
Analyzing the EPS growth rate metric is a practical method for investors to gauge a public company’s historical profitability as well as develop an understanding of its near-term trajectory, for purposes related to forecasting future performance.
EPS, shorthand for “earnings per share”, is the ratio between a company’s net income and the number of shares outstanding.
Where:
- Net Income → The accounting profits of a company over a specified time period (the “bottom line”)
- Total Number of Shares Outstanding → The total number of shares outstanding can be either the basic or diluted shares outstanding. The latter is the more conservative and is our recommended approach, since the share count should reflect any potentially dilutive securities such as options and warrants.
The diluted share count is estimated using the treasury stock method (TSM), which approximates a company’s earnings per share (EPS) under the assumption that any outstanding dilutive securities are exercised.
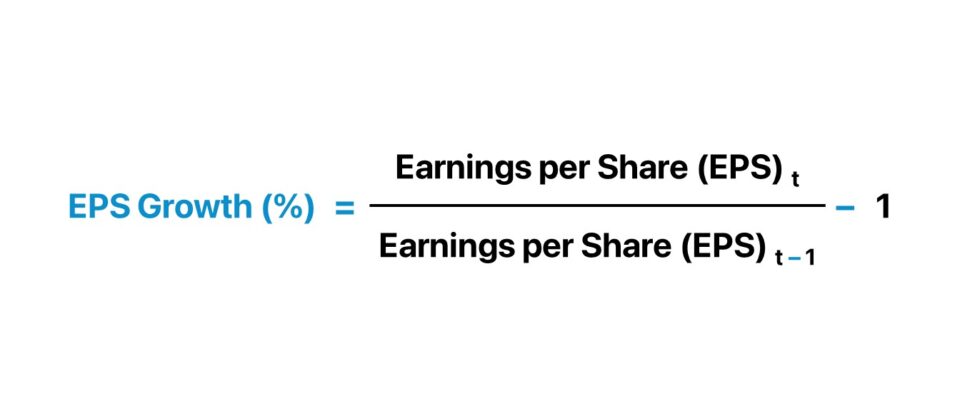
EPS Growth Formula
The EPS growth rate formula is as follows.
To convert the growth rate from decimal notation to a percentage, the output must then be multiplied by 100.
Because publicly traded companies in the U.S. report earnings each quarter per SEC requirements, EPS growth is most often also tracked on a quarterly basis.
The Wharton Online & Wall Street Prep Applied Value Investing Certificate Program
Learn how institutional investors identify high-potential undervalued stocks. Enrollment is open for the upcoming cohort.
Enroll TodayHow Does EPS Growth Impact Stock Price?
The earnings per share (EPS) metric is critical to analyze for investors in the public equities markets because a company’s reported EPS is frequently relied upon to estimate the value of its equity.
For instance, the price-to-earnings ratio (or “P/E ratio”) is a common valuation multiple that divides a company’s current market price by its earnings per share (EPS).
If the P/E ratio of a company is lower relative to comparable companies that operate in the same (or adjacent) industry, the market could decide the company’s shares are underpriced.
In effect, a subsequent influx of volume in purchases among buyers in the market can often cause the stock price of a company to rise, all else being equal.
Upon rearranging the P/E ratio formula to solve for the implied market price, the implied stock price of a company – assuming a constant P/E ratio – is the current P/E ratio multiplied by the forecasted EPS.
Hence, the quarterly EPS targets set by equity research analysts and forward-looking management guidance are followed closely by the market, i.e. to determine an “earnings beat” vs. an “earnings miss”.
Therefore, positive EPS growth frequently coincides with a higher stock price (and vice versa for negative EPS growth).
If a company were to report outsized EPS growth – in excess of the consensus among equity analysts – the “earnings surprise” would be perceived positively by market participants and the company would be rewarded with a higher stock price.
Why? The core drivers that determine a company’s profitability have seemingly improved given the positive trajectory, albeit further analysis is necessary to confirm the actual driver(s).
What is a Good EPS Growth Rate?
There is no “good” EPS growth rate, per se, that all public companies attempt to meet, since the average profit margins (and “upside” in profit potential) varies substantially across different industries.
An EPS growth rate that exceeds the prior period, or is greater than the growth rate of industry comparables, is perceived positively by the market.
To reiterate, however, the underlying drivers for the rise in EPS and other factors, such as the maturity of the company (i.e. its stage in the corporate lifecycle), must be considered to avoid the risk of misinterpreting a company’s EPS growth.
Nevertheless, the EPS growth rate is just one factor among many others that determines the market price of a company’s shares, so it is critical to determine the full picture by using various metrics.
How to Interpret EPS Growth Rate?
The EPS growth rate cannot be used as a standalone metric to guide investing decisions. Instead, the EPS growth rate should be analyzed in conjunction with various other financial metrics, as the ratio on its own is an imperfect measure of profitability.
The shortcomings of the earnings per share (EPS) metric stem primarily from the ratio’s profit metric, net income, which represents the accrual-based earnings of a company inclusive of all operating and non-operating costs.
While accrual accounting is the standardized financial reporting method for publicly traded companies in the U.S., there are still flaws that can distort the earnings of a company, including room for earnings manipulation.
For example, a public company’s management team and board of directors could incorporate an aggressive stock buyback program to reduce its total number of shares in circulation, causing a sudden rise in its EPS.
But the company’s fundamentals such as its revenue growth and free cash flow (FCF) – the determinants of a company’s valuation (and stock price), at least in theory – might not have actually improved.
EPS Growth Calculator
We’ll now move to a modeling exercise, which you can access by filling out the form below.
1. Income Statement Assumptions
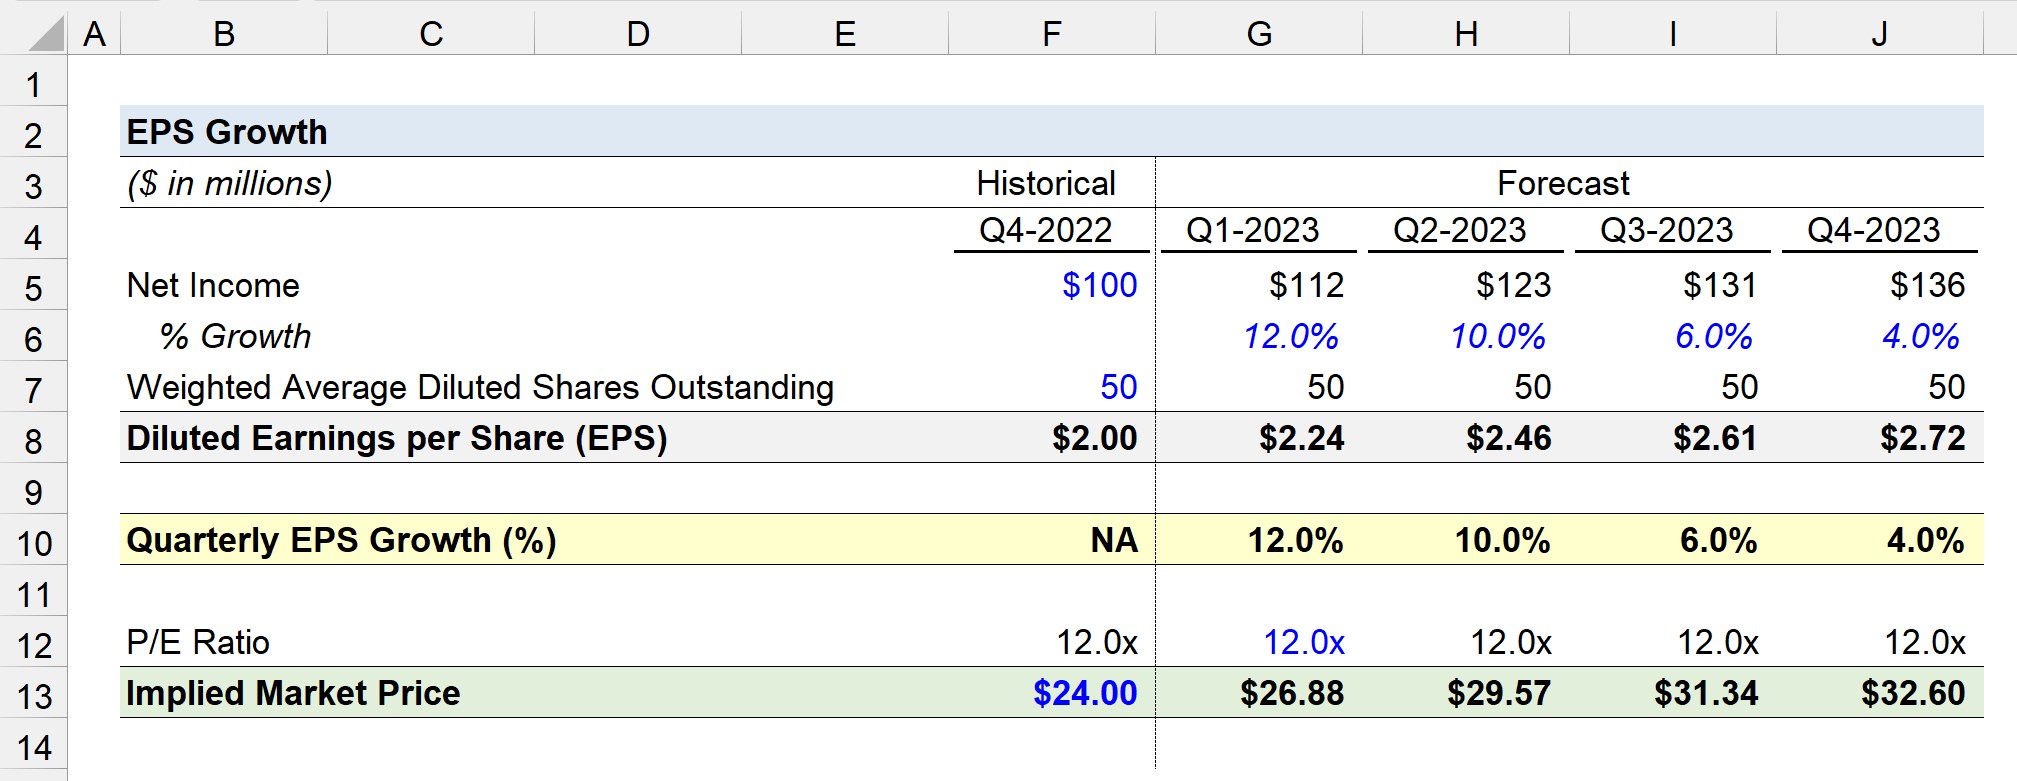
Suppose you’re tasked with calculating the EPS growth rate of a public company that reported $100 million in net income in the most recent quarter (Q4-2022).
- Net Income, Q-4 2022 = $100 million
For the forecast period – the next four quarters – the company’s net income is estimated to increase by 12.0%, 10.0%, 6.0% and 4.0%, respectively.
By multiplying the prior period net income by (1 + % growth rate assumption) for each quarter, we arrive at the following pro forma net income figures.
- Net Income, Q1 2023 = $100 million × (1 + 12.0%) = $112 million
- Net Income, Q2 2023 = $112 million × (1 + 10.0%) = $123 million
- Net Income, Q3 2023 = $123 million × (1 + 6.0%) = $131 million
- Net Income, Q4 2023 = $131 million × (1 + 4.0%) = $136 million
To compute the earnings per share (EPS) metric for all periods, the missing assumption is the weighted average diluted share count, which we’ll assume to be fixed at 50 million in each period.
- Weighted Average Diluted Shares Outstanding = 50 million
2. EPS Growth Calculation Example
Given our projected net income values and the constant share count (“straight-lined”), we can calculate the diluted earnings per share (EPS) by dividing net income by the share count.
- Diluted EPS, Q4, 2022 = $100 million ÷ 50 million = $2.00
- Diluted EPS, Q1, 2023 = $112 million ÷ 50 million = $2.24
- Diluted EPS, Q2, 2023 = $123 million ÷ 50 million = $2.46
- Diluted EPS, Q3, 2023 = $131 million ÷ 50 million = $2.61
- Diluted EPS, Q4, 2023 = $136 million ÷ 50 million = $2.72
In the next step, our company’s quarterly EPS growth rate can be determined by dividing the current period EPS by the prior period EPS for the forecast period.
- Quarterly EPS Growth (%), Q1-2023 = ($2.24 ÷ $2.00) – 1 = 12.0%
- Quarterly EPS Growth (%), Q2-2023 = ($2.46 ÷ $2.24) – 1 = 10.0%
- Quarterly EPS Growth (%), Q3-2023 = ($2.61 ÷$2.46) – 1 = 6.0%
- Quarterly EPS Growth (%), Q4-2023 = ($2.72 ÷ $2.61) – 1 = 4.0%
Because of our earlier assumption that our company’s diluted share count will remain unchanged over the course of the entire forecast period, the quarterly EPS growth rates are the same as our growth rate assumptions for net income.
3. EPS Growth Ratio Analysis
The final part of our exercise will consist of estimating the implied market price using projected EPS and P/E ratio.
At the end of Q-4 2022, we’ll assume the market price of the company’s shares are trading at $24.00 per share.
Therefore, the historical P/E ratio is 12.0x, which we computed by dividing our market price assumption ($24.00) by the diluted EPS in the coinciding period ($2.00).
- P/E Ratio, Q-4 2022 = $24.00 ÷ $2.00 = 12.0x
Like our share count assumption, we’ll assume the P/E ratio of our hypothetical company remains the same over the projection period.
Upon multiplying the forecasted EPS for each quarter in 2023 by the 12.0x P/E ratio, we arrive at the following estimates for our company’s market share price.
- Implied Market Price, Q1-2023 = 12.0x × $2.24 = $26.88
- Implied Market Price, Q2-2023 = 12.0x × $2.46 = $29.57
- Implied Market Price, Q3-2023 = 12.0x × $2.61 = $31.34
- Implied Market Price, Q4-2023 = 12.0x × $2.72 = $32.60
In closing, the implied market price at the end of our forecast period – Q4 2023 – comes out to $32.60, assuming the share count and P/E ratio remain constant.