
- What is Gordon Growth Model?
- How to Calculate Gordon Growth Model (GGM)?
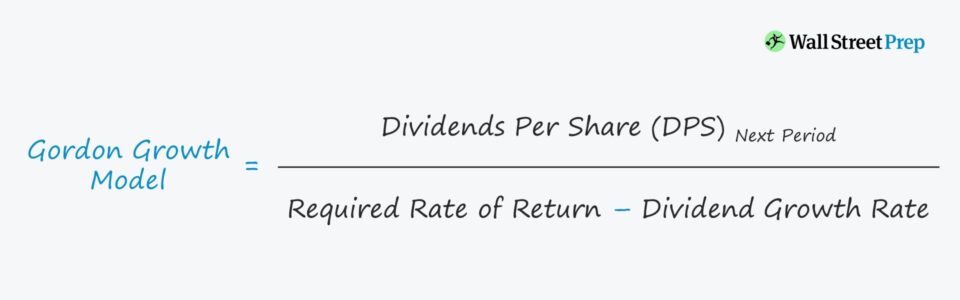
- Gordon Growth Model Formula
- DCF Terminal Value Calculation – Growth in Perpetuity Approach
- How to Calculate Cap Rate Using Gordon Growth Model
- Gordon Growth Model (GGM): What are the Pros and Cons?
- Gordon Growth Model Calculator — Excel Template
- 1. Gordon Growth Model Calculation Example
- 2. Gordon Growth Model Projection Period
- 3. Gordon Growth Model Stock Price Calculation Example
What is Gordon Growth Model?
The Gordon Growth Model calculates a company’s intrinsic value under the assumption that its shares are worth the sum of all its future dividends discounted back to their present value (PV).
Considered the simplest variation of the dividend discount model (DDM), the single-stage Gordon Growth Model assumes a company’s dividends continue to grow indefinitely at a constant rate.
How to Calculate Gordon Growth Model (GGM)?
The Gordon Growth Model (GGM), named after economist Myron J. Gordon, calculates the fair value of a stock by examining the relationship between three variables.
- Dividends Per Share (DPS) ➝ DPS is the value of each declared dividend issued to shareholders for each common share outstanding, and represents how much money shareholders should expect to receive on a per-share basis.
- Dividend Growth Rate (g) ➝ The dividend growth rate is the projected rate of annual growth, which in the case of a single-stage GGM, a constant growth rate is assumed.
- Required Rate of Return (r) ➝ The required rate of return is the “hurdle rate” demanded by equity shareholders to invest in the company’s shares with consideration towards other opportunities with similar risks in the stock market.
Given the fixed dividend issuance growth rate assumption, the Gordon Growth Model is suited for companies with steady dividend growth and no plans for adjustments.
Thus, the GGM is used most frequently for mature companies in established markets with minimal risks that would create the need to cut (or end) their dividend payout program.
The Gordon Growth Model approximates the intrinsic value of a company’s shares using the dividend per share (DPS), the growth rate of dividends, and the required rate of return.
- Undervalued ➝ If the share price calculated from the GGM is greater than the current market share price, the stock is undervalued and could be a potentially profitable investment.
- Overvalued ➝ If the calculated share price is less than the current market price, the shares are considered overvalued.
Gordon Growth Model Formula
The Gordon Growth Model (GGM) values a company’s share price by assuming constant growth in dividend payments.
The formula requires three variables, as mentioned earlier, which are the dividends per share (DPS), the dividend growth rate (g), and the required rate of return (r).
Since the GGM pertains to equity holders, the appropriate required rate of return (i.e., the discount rate) is the cost of equity.
If the expected DPS is not explicitly stated, the numerator can be calculated by multiplying the DPS in the current period by (1 + Dividend Growth Rate %).
For example, if a company’s shares are trading at $100 per share and a minimum required rate of return of 10% (r) with plans to issue a $4.00 dividend per share (DPS) next year, which is expected to increase by 5% annually (g).
- Value Per Share = $4.00 ÷ (10.0% – 5.0%) = $80.00
Given the output, the key takeaway here is that the share price of the company is implied to be overpriced by approximately 25.0% ($100 vs. $85).
DCF Terminal Value Calculation – Growth in Perpetuity Approach
Often referred to as the “Growth in Perpetuity Approach” in DCF analyses, another use-case of the Gordon Growth Model is to calculate the terminal value (TV) of a company at the end of the stage-one cash flow projection period.
To calculate the terminal value, a perpetual growth rate assumption is attached for the forecasted cash flows beyond the initial forecast period.
How to Calculate Cap Rate Using Gordon Growth Model
In the context of real estate investing, the Gordon Growth Model offers an alternative method to calculate the capitalization rate (or “cap rate”) by assuming a consistent annual growth rate in net operating income (NOI).
The Gordon Growth Model (GGM) estimates the value of a property, such as a residential apartment complex or commercial office building, based on its net operating income (NOI), discount rate, and steady growth rate.
The practical utility of the GGM in real estate is contingent on determining an appropriate growth rate, as the equation consists of merely three components:
- Net Operating Income (NOI)
- Discount Rate (r)
- Constant Growth Rate (g)
The cap rate can be expressed as the discount rate subtracted by the perpetual growth rate assumption, i.e., the growth rate at which the cash flow will increase by on a perpetual basis.
Conceptually, the Gordon Growth Model (GGM) states the cap rate is the difference between the property’s expected annual rate of return and the expected annual growth in net operating income (NOI).
The formula used to determine the valuation of a real estate property using the Gordon Growth Model is equal to net operating income (NOI) divided by the difference between the discount rate and constant growth rate assumption.
The constant growth rate must be reasonable, since the implicit assumption is that the NOI of the property will continue to grow at that rate in perpetuity, which refers to a set of cash flows that will continue indefinitely.
The cap rate is the difference between the discount rate and perpetual growth rate.
Like earlier, the constant growth rate (g) cannot exceed the discount rate (r).
The Wharton Online & Wall Street Prep Applied Value Investing Certificate Program
Learn how institutional investors identify high-potential undervalued stocks. Enrollment is open for the upcoming cohort.
Enroll TodayGordon Growth Model (GGM): What are the Pros and Cons?
The Gordon Growth Model (GGM) offers a convenient, easy-to-understand method for calculating the approximate value of a company’s share price.
As we saw earlier, the single-stage model requires only a handful of assumptions, but this aspect tends to restrict the accuracy of the model when it comes to high-growth companies with changing capital structures, dividend payout policies, etc.
Instead, the GGM is most applicable for mature companies with a consistent track record of profitability and issuance of dividends.
The main drawback to the GGM is the assumption that dividends will continue to grow at the same rate indefinitely.
In reality, companies and their business model undergo significant adjustments as time passes and as new risks emerge in the market.
Because of the assumption that dividends grow at a fixed rate perpetually, the model is most meaningful for mature, established companies with consistent growth in dividends.
Another concern for reliance on the GGM is that underperforming companies can issue large dividends to themselves (e.g., a reluctance to cut dividends) despite the deterioration in their financials.
Hence, a disconnect between the fundamentals of the company and the dividend policy can occur, which the GGM would not capture.
Gordon Growth Model Calculator — Excel Template
We’ll now move to a modeling exercise, which you can access by filling out the form below.
1. Gordon Growth Model Calculation Example
In our example scenario, the following assumptions will be used:
Model Assumptions
- Dividends Per Share (DPS) – Current Period: $5.00
- Required Rate of Return (ke): 8.0%
- Expected Dividend Growth Rate (g): 3.0%
Based on those assumptions, the company has issued a dividend per share (DPS) of $5.00 in the latest period (Year 0), which is expected to grow at a constant 3.0% each year into perpetuity.
In addition, the required rate of return (i.e., the cost of equity) for this company is 8.0%.
Note that similar to a discounted cash flow model, if the expected perpetuity growth rate were to be greater than the required rate of return, adjustments to the assumptions would be required.
Otherwise, the calculated share prices from the model would be meaningless, and other valuation methods would be more appropriate.
Value Per Share Calculation in Year 0
- Dividends Per Share (DPS): $5.00
- Required Rate of Return (Ke): 8.0%
- Expected Dividend Growth Rate (g): 3.0%
- Value Per Share ($) = $5.00 DPS ÷ (8.0% – 3.0%) = $100
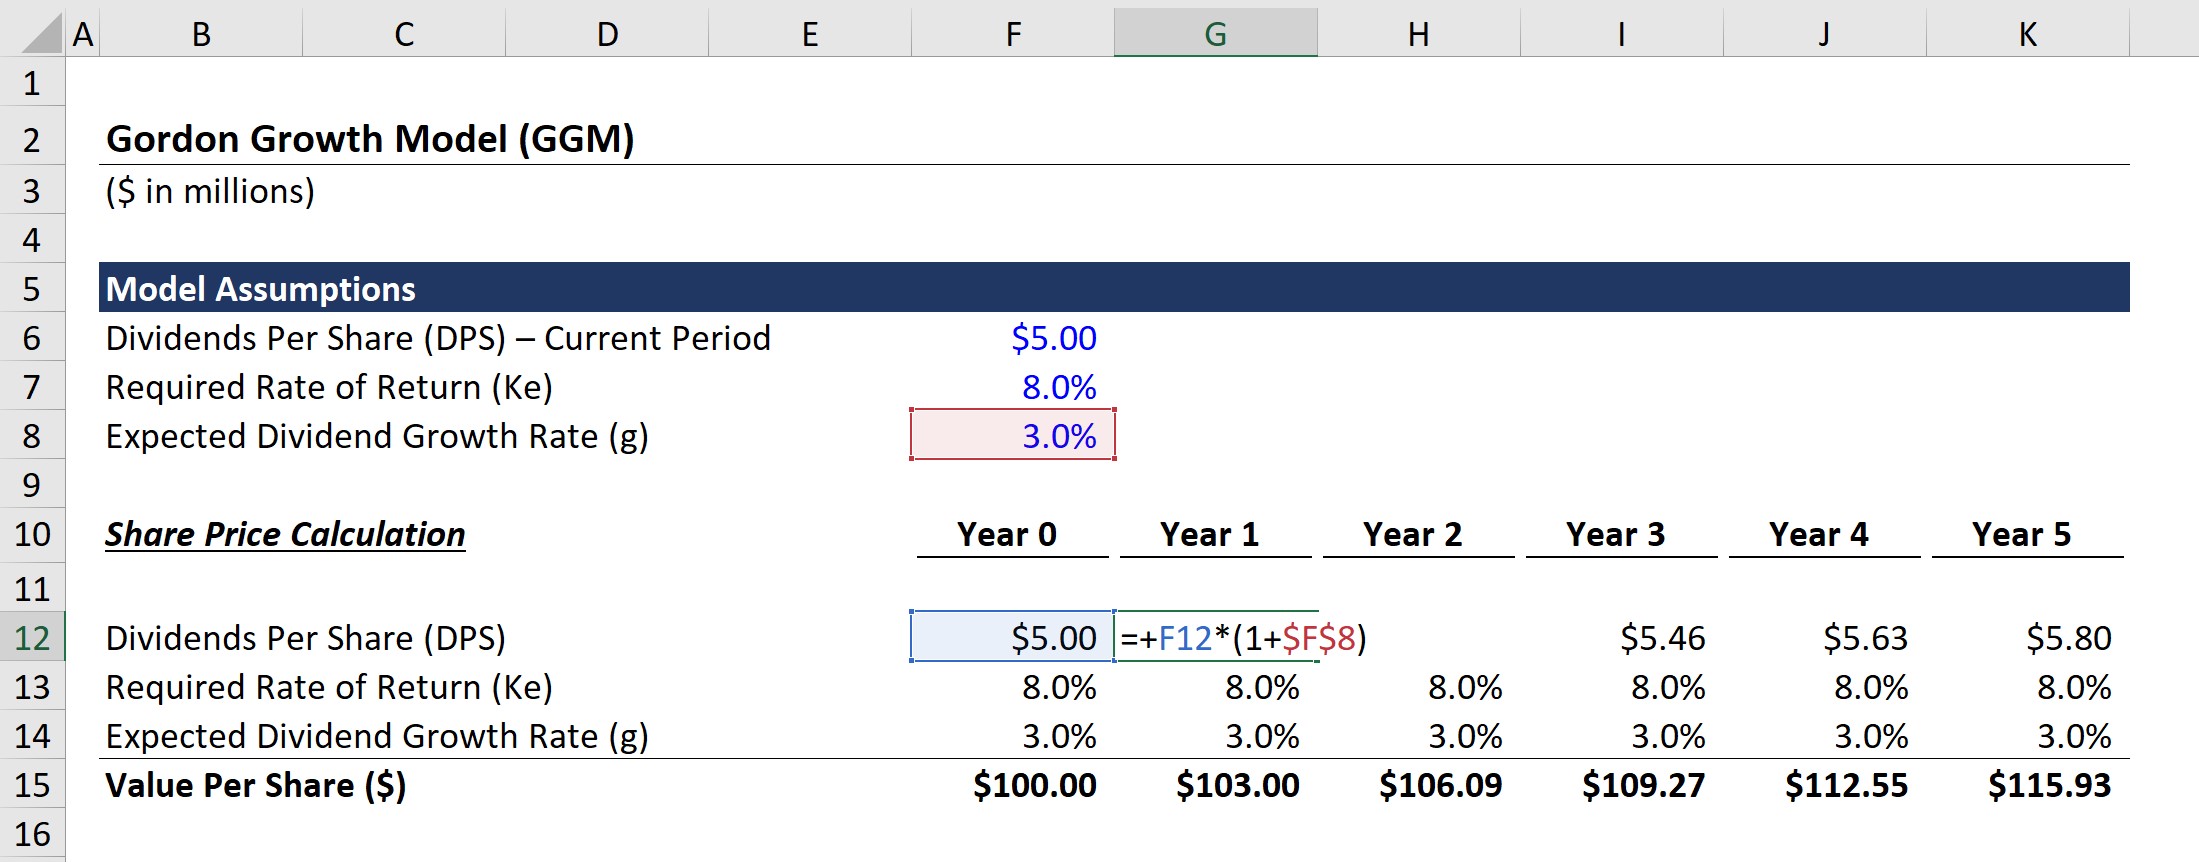
2. Gordon Growth Model Projection Period
Next, we’ll need to extend the assumptions across the forecast period from Year 1 to Year 5.
By multiplying the dividends per share (DPS) of $5.00 in Year 0 by (1 + 3.0%), we get $5.15 as the DPS in Year 1 – and this same process will be repeated for each forecast period.
As for the required rate of return and expected dividend growth rate, we can simply link to our model assumptions section and hard-code the amounts since both are assumed to remain constant.
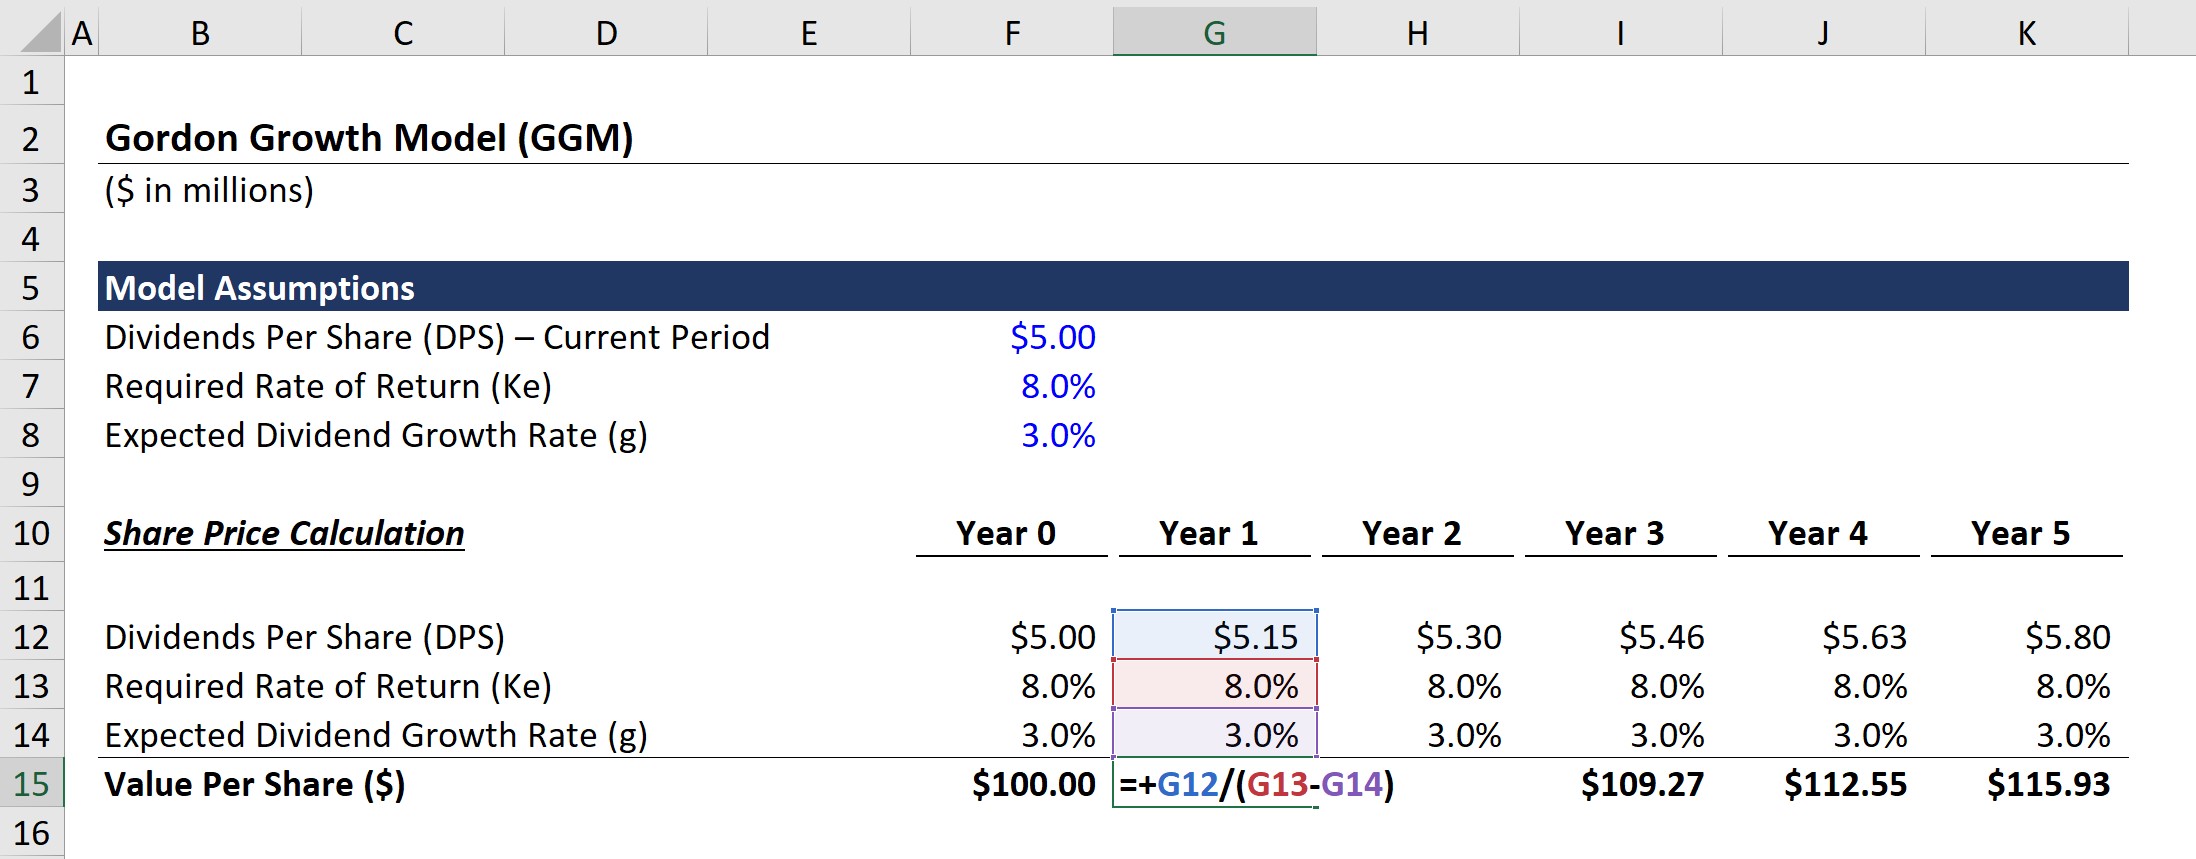
3. Gordon Growth Model Stock Price Calculation Example
In the final section, we’ll calculate the Gordon Growth Model derived value per share in each period.
The formula consists of taking the DPS in the period by (Required Rate of Return – Expected Dividend Growth Rate).
For example, the value per share in Year is calculated using the following equation:
- Value Per Share ($) = $5.15 DPS ÷ (8.0% Ke – 3.0% g) = $103.00
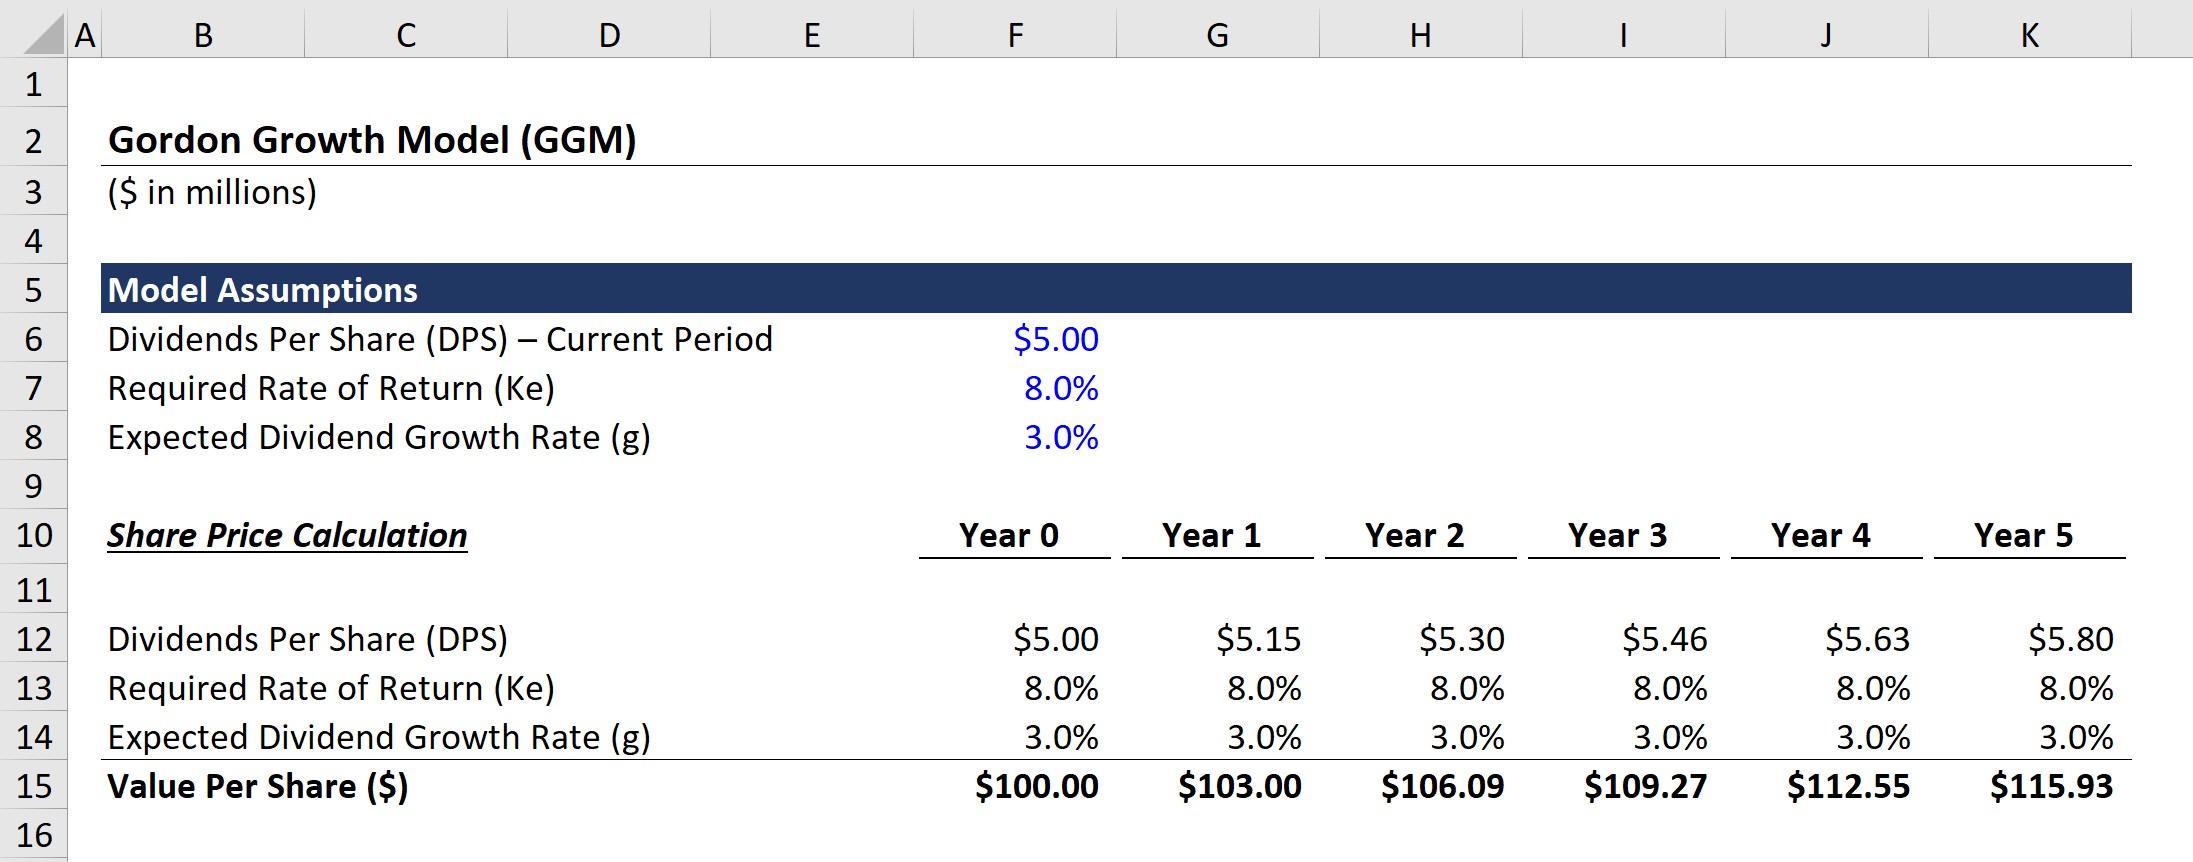
From the completed model output, we can see how from Year 0 to Year 5, the estimated share price grows from $100.00 to $115.93, which is driven by the incremental increase in the dividends per share (DPS) of $0.80 in the same time span.

")
")

