
What is Payback Period?
The Payback Period measures the amount of time required to recoup the cost of an initial investment via the cash flows generated by the investment.
How to Calculate Payback Period
The payback period is a fundamental capital budgeting tool in corporate finance, and perhaps the simplest method for evaluating the feasibility of undertaking a potential investment or project.
Conceptually, the payback period is the amount of time between the date of the initial investment (i.e., project cost) and the date when the break-even point has been reached.
The break-even point (BEP) refers to the threshold at which the amount of revenue produced by the project is equal to the associated costs.
While there certainly are exceptions (i.e., projects that necessitate significant time before generating sustainable profits), a large portion of companies – especially those that are publicly traded – tend to be more short-term oriented and focus on near-term revenue and earnings per share (EPS) targets.
For a public company, the stock price of the company could falter if near-term sales or profitability goals are not met, as the market is unlikely to uphold the current valuation just because management claims to be operating with a longer-term horizon in mind.
Each company will internally have its own set of standards for the timing criteria related to accepting (or declining) a project, but the industry that the company operates within also plays a critical role.
In addition, the potential returns and estimated payback time of alternative projects the company could pursue instead can also be an influential determinant in the decision (i.e. opportunity costs).
What is a Good Payback Period?
As a general rule of thumb, the shorter the payback period, the more attractive the investment, and the better off the company would be.
- Shorter Payback Period → The earlier the cash flows from a potential project can offset the initial investment, the greater the likelihood that the company or investor will proceed with pursuing the project.
- Longer Payback Period → In contrast, the longer it takes for a project to “pay for itself”, the less attractive the project becomes as it implies reduced profitability.
Why? The sooner the break-even point is met, the more likely additional profits are to follow (or at the very least, the risk of losing capital on the project is significantly reduced).
A longer payback time, on the other hand, suggests that the invested capital is going to be tied up for a long period.
Thus, the project is deemed illiquid and the probability of there being comparatively more profitable projects with quicker recoveries of the initial outflow is far greater.
Payback Period Formula
In its simplest form, the formula to calculate the payback period involves dividing the cost of the initial investment by the annual cash flow.
Where:
- Initial Investment → Cash Outflow in Period 0
- Cash Flow Per Year → Annual Cash Flow Generated
Illustrative Payback Period Example
For instance, let’s say you own a retail company and are considering a proposed growth strategy that involves opening up new store locations in the hopes of benefiting from the expanded geographic reach.
The essential question being answered from the calculation is, “Given the cost of opening up new store locations in different states, how long would it take for revenue from those new stores to pay back the entire amount of the investment?”
If opening the new stores amounts to an initial investment of $400,000 and the expected cash flows from the stores would be $200,000 each year, then the period would be 2 years.
- $400k ÷ $200k = 2 Years
So it would take two years before opening the new store locations has reached its break-even point and the initial investment has been recovered.
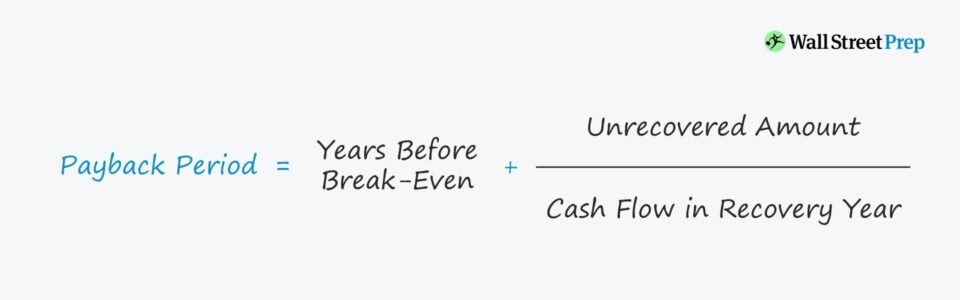
Years to Break-Even Formula
But since the payback period metric rarely comes out to be a precise, whole number, the more practical formula is as follows.
Where:
- Years Before Break-Even → The number of full years until the break-even point is met. In other words, it is the number of years the project remains unprofitable.
- Unrecovered Amount → The negative balance in the year preceding the year in which the cumulative net cash flow of the company exceeds zero.
- Cash Flow in Recovery Year → The amount of cash flow produced by the company in the year that the initial investment cost has been recovered and is now turning a profit.
Payback Period Calculator
We’ll now move to a modeling exercise, which you can access by filling out the form below.
1. Payback Period Calculation Example
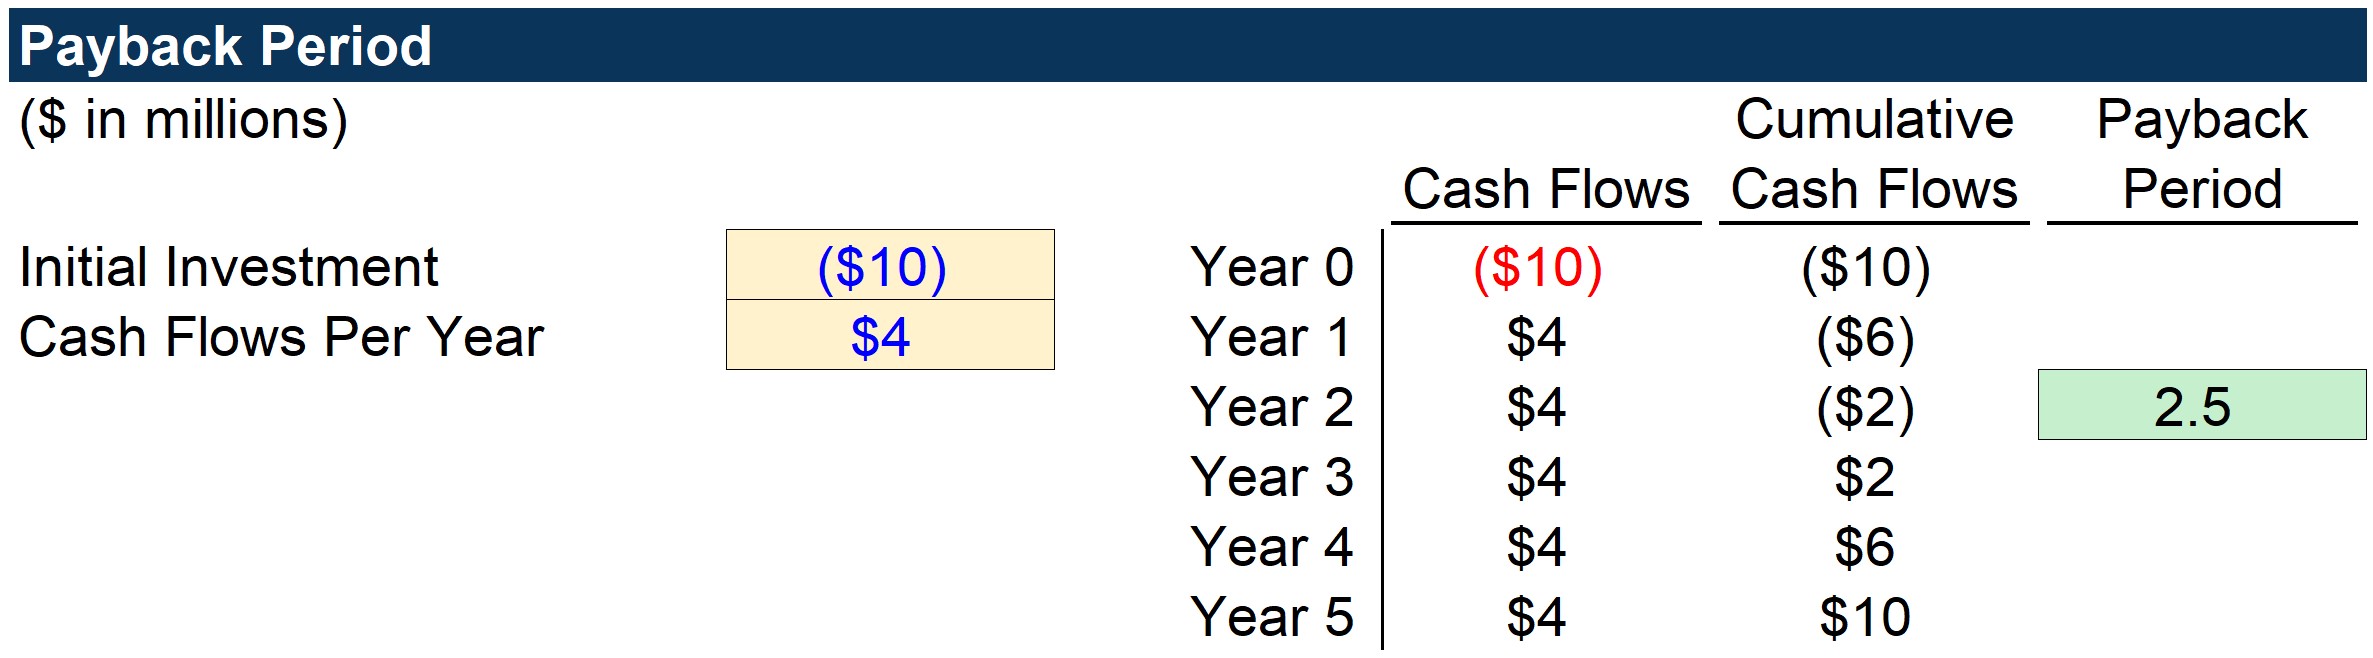
First, we’ll calculate the metric under the non-discounted approach using the two assumptions below.
- Initial Investment = $10 million
- Cash Flows Per Year = $4 million
Our table lists each of the years in the rows and then has three columns.
The first column (Cash Flows) tracks the cash flows of each year – for instance, Year 0 reflects the $10mm outlay whereas the others account for the $4mm inflow of cash flows.
Next, the second column (Cumulative Cash Flows) tracks the net gain/(loss) to date by adding the current year’s cash flow amount to the net cash flow balance from the prior year.
Hence, the cumulative cash flow for Year 1 is equal to ($6mm) since it adds the $4mm in cash flows for the current period to the negative $10mm net cash flow balance.
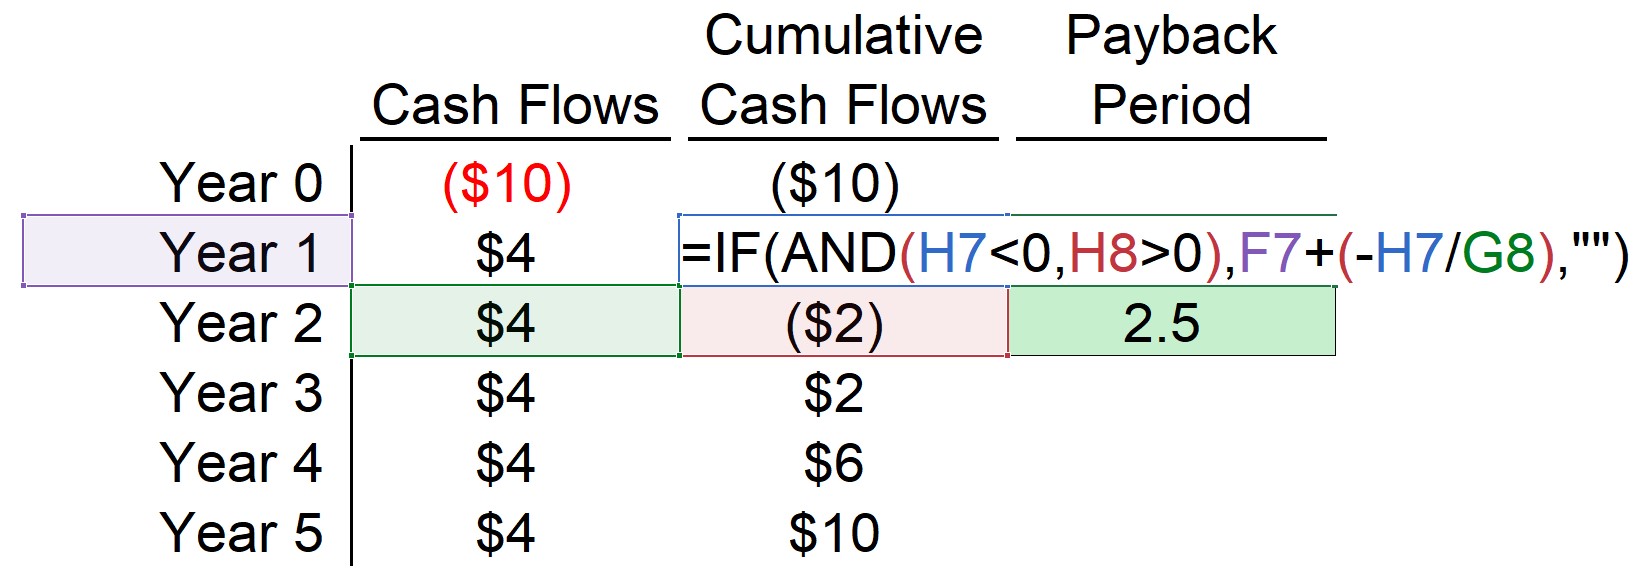
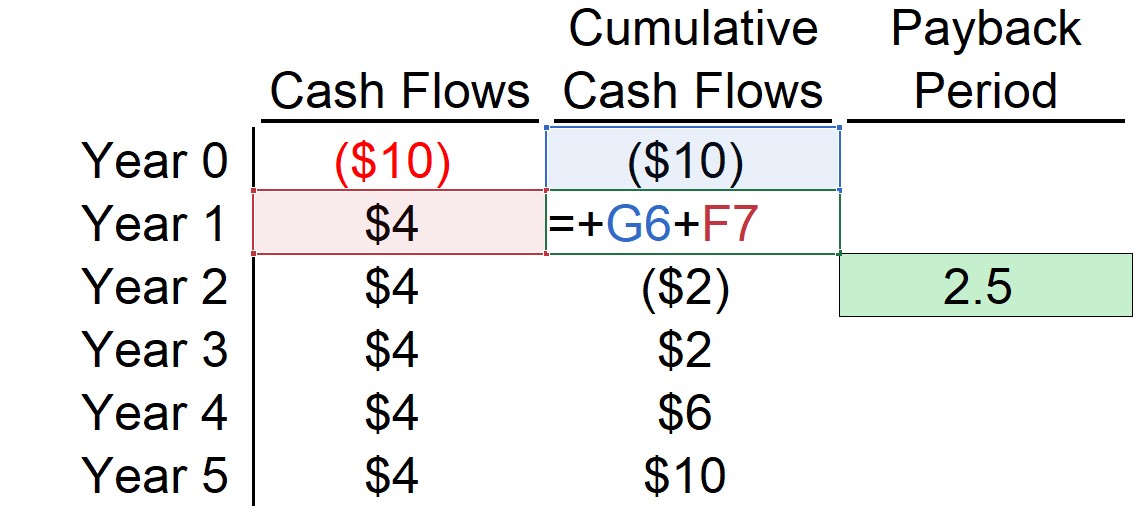 The third and final column is the metric that we are working towards and the formula uses the “IF(AND)” function in Excel that performs the following two logical tests.
- The current year’s cumulative cash balance is less than zero
- The next year’s cumulative cash balance is greater than zero
If the two are true, that means the break-even occurs in between the two years – and therefore, the current year is selected.
But because there is likely a fractional period that we cannot neglect, we must divide the cumulative cash flow balance for the current year (negative sign in front) by the cash flow amount of the next year, which is then added to the current year from earlier.
The screenshot below shows the formula in Excel.
From the finished output of the first example, we can see the answer comes out to 2.5 years (i.e., 2 years and 6 months).
By the end of Year 2, the net cash balance is negative $2mm, and $4mm in cash flows will be generated in Year 3, so we add the two years that passed before the project became profitable, as well as the fractional period of 0.5 years ($2mm ÷ $4mm).
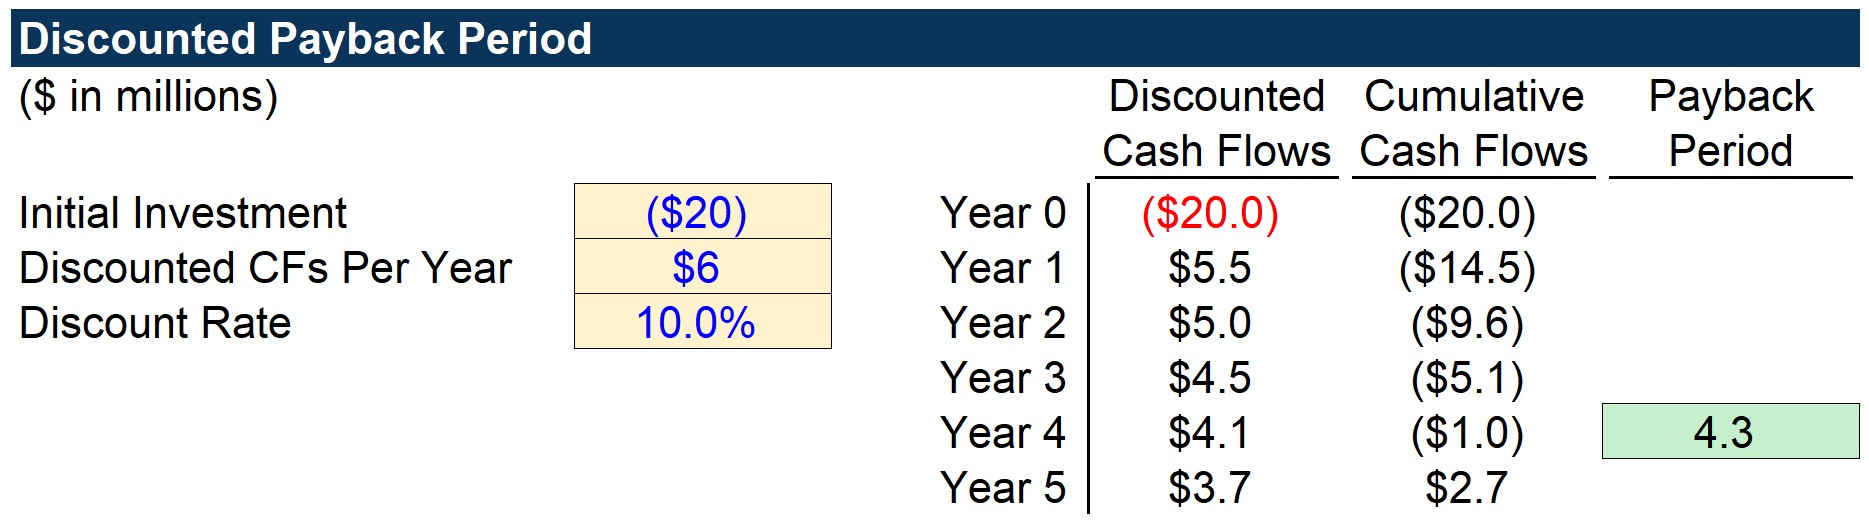
2. Discounted Payback Period Calculation Analysis
Moving onto our second example, we’ll use the discounted approach this time around, i.e. accounts for the fact that a dollar today is more valuable than a dollar received in the future.
The three model assumptions are as follows.
- Initial Investment = $20 million
- Cash Flows Per Year = $6 million
- Discount Rate = 10.0%
The table is structured the same as the previous example, however, the cash flows are discounted to account for the time value of money.
Here, each cash flow is divided by “(1 + discount rate) ^ time period”. But other than this distinction, the calculation steps are the same as in the first example.
In closing, as shown in the completed output sheet, the break-even point occurs between Year 4 and Year 5. So, we take four years and then add ~0.26 ($1mm ÷ $3.7mm), which we can convert into months as roughly 3 months, or a quarter of a year (25% of 12 months).
The takeaway is that the company retrieves its initial investment in approximately four years and three months, accounting for the time value of money.

Everything You Need To Master Financial Modeling
Enroll in The Premium Package: Learn Financial Statement Modeling, DCF, M&A, LBO and Comps. The same training program used at top investment banks.
Enroll Today")


