What is SG&A?
SG&A, or “selling, general and administrative” describes the expenses incurred by a company not directly tied to generating revenue.
Unlike a company’s cost of goods sold (COGS), SG&A represents the indirect costs of operating the business day-to-day, meaning that these operating costs are necessary to be incurred in order for its operations to continue running.

How to Calculate SG&A Expense?
SG&A stands for “selling, general & administrative”, and is a catch-all category of expenses that is inclusive of spending that isn’t a direct cost, otherwise known as cost of goods sold (COGS).
The SG&A expense is recorded on the income statement of companies in the section below the gross profit line item.
The difference between the SG&A expense and cost of goods sold (COGS) line item is as follows.
- SG&A Expense: SG&A is intended to capture the indirect costs included in a company’s core operating business yet are not directly connected to the manufacturing of the products or delivery of the services.
- Cost of Goods Sold (COGS): While SG&A primarily represents indirect costs unrelated to the core production of revenue, a company’s cost of goods sold (COGS) are directly related to revenue generation. For that reason, the first area that companies implementing cost-cutting initiatives tends to look at is their SG&A spending as opposed to COGS.
The differential between gross profit and EBIT, assuming there are no other operating expenses, represents the incurred SG&A expense in the given period.
The calculation excludes interest expense since interest is reported as a “non-operating” expense (i.e. non-core). Likewise, the taxes paid to the government are also not included under the same rationale.
SG&A Expense Formula
Once SG&A is deducted from gross profit – assuming there are no other operating expenses – operating income (EBIT) remains.
From here, you can divide EBIT by revenue to calculate the operating margin.
While rather uncommon in practice, a company’s SG&A expense can be derived by rearranging the first formula.
The resulting figure should be negative, which is our recommended sign convention and modeling best practice. However, the two profit metrics can be switched around if needed, i.e. in order to arrive at a positive value.
What Does SG&A Stand For?
In this section, we’ll elaborate of the full-form components of the SG&A expense line item.
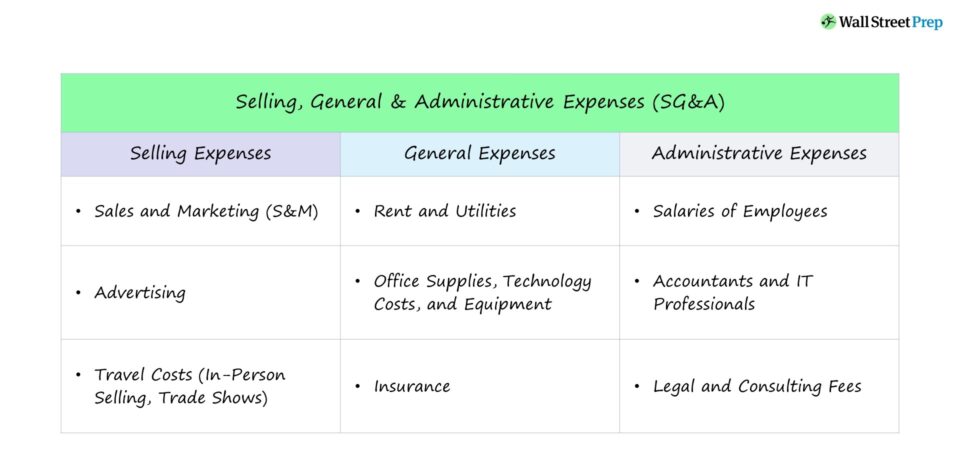
Selling Expense
Examples of “selling” expenses include the following:
- Sales and Marketing (S&M)
- Advertising
- Travel Costs (i.e. In-Person Selling, Trade Shows)
General Expense
Next, examples of “general” expenses include the following:
- Rent
- Utilities
- Technology Costs
- Equipment Costs
- Office Supplies
- Insurance
Administrative Expense
As for the last category, examples of “administrative” expenses are the following:
- Salaries of Employees (e.g. Executives, Administrative Staff, Human Resources)
- Accountants
- IT Professionals
- Lawyers
- Consulting Fees
SG&A Ratio Calculation Example
The SG&A ratio is simply the relationship between SG&A and revenue – i.e. the expense expressed as a percentage of total sales.
The SG&A ratio measures what percentage of each dollar earned by a company is impacted by SG&A.
For example, let’s say that we have a company with $6 million in SG&A and $24 million in total revenue.
- SG&A Ratio = $6,000 / $24,000 = 25%
The 25% ratio means that for each dollar of revenue created, $0.25 gets spent on SG&A expenses.
For purposes of creating a projection model, SG&A as a % of historical revenue is calculated, and then either:
- The trend of the ratio is followed for future periods (i.e. increasing, decreasing) until the normalized % is reached, which is based on industry averages.
- If unchanged in recent years, the ratio assumption for projected periods can be extended throughout the entirety of the forecast period.
What is a Good SG&A Expense?
Generally speaking, the lower a company’s SG&A expense, the better – since that implies the company is more profitable, all else being equal.
However, the SG&A expense must be standardized to be compared side-by-side to industry comparables, and the average benchmark varies significantly based on the specific industry.
For example, the SG&A ratio for manufacturers can range anywhere around 20% of revenue, while in healthcare it can be up to 50% of revenue.
Certain companies will file their financial statements with one line for SG&A, while others – for example, software companies – will separately break out G&A and sales & marketing.
The distinction found in the financials will be based on the relative size of each, which depends on the specific industry in question.
What is the Difference Between SG&A vs. Operating Expense?
On the income statement, operating expenses and SG&A typically represent the same costs – those that do NOT qualify as COGS.
But as mentioned earlier, the line item can be broken out individually depending on the size of the cost and relevance to the core business model.
Therefore, operating expenses and SG&A are terms that are often used interchangeably, but differences can arise if, for instance, depreciation and amortization (D&A) are broken out in a separate line item.

Everything You Need To Master Financial Modeling
Enroll in The Premium Package: Learn Financial Statement Modeling, DCF, M&A, LBO and Comps. The same training program used at top investment banks.
Enroll Today


