 Skip to main content
What is Operating Profit?
Operating Profit is a profitability metric that measures the remaining income of a company after deducting operating costs, which comprises the cost of goods sold (COGS) and operating expenses (Opex).
The formula to calculate operating profit subtracts operating costs—which refer to the direct and indirect costs incurred for the day-to-day operations of a business to continue running—from revenue.
- Operating profit measures a company’s profitability from its core business activities, excluding non-operating items like interest expense and taxes.
- Operating profit is calculated by subtracting operating costs (i.e. cost of goods sold and operating expenses) from revenue.
- The operating profit formula is: Operating Profit = Gross Profit – Operating Expenses.
- The operating margin is the ratio between operating profit and revenue, expressed as a percentage.
- Operating profit differs from net income in that the metric is unaffected by a company’s capital structure, discretionary management decisions, and non-operating items like income taxes.
How to Calculate Operating Profit
The operating profit is a measure of a company’s profitability from its core business activities, excluding the effects of discretionary items such as interest expense and taxes.
In short, the operating income of a company is determined by subtracting its cost of goods sold (COGS) and operating expenses (SG&A, R&D) from its revenue.
COGS and operating expenses (Opex) are each categorized as “operating costs” but COGS are direct costs, while operating expenses are indirect costs.
Therefore, the operating profit metric reflects the profitability of a company’s core operations over a predefined period.
Non-operating items like interest expense are a function of a company’s capital structure (i.e., its funding sources), whereas taxes are jurisdiction-dependent and affected by items like net operating losses (NOLs).
The step-by-step process to calculate operating profit is as follows.
- Step 1 ➝ Compute Gross Profit (Subtract Revenue by COGS)
- Step 2 ➝ Determine Operating Expenses (OpEx)
- Step 3 ➝ Subtract Gross Profit by Operating Expenses
Operating Profit Formula
The operating profit formula is as follows.
Where:
- Gross Profit = Revenue – Cost of Goods Sold (COGS)
The operating expenses of a company refer to the indirect costs of a company that are still considered to be a core part of its operations.
Unlike COGS, operating expenses are not directly related to the revenue generation of the company. However, the expenses must be incurred for day-to-day business functions to continue.
How to Find Operating Profit on Income Statement
On the income statement, the “Operating Profit” line item reflects the cut-off point below which the non-operating items such as interest income and interest expense start to appear.
The operating profit of a company is often recorded as “Operating Income”, “EBIT”, or Income from Operations”, which are all interchangeable terms that are conceptually identical in meaning.
From the “Gross Profit” line item, the common line items that comprise the operating expenses section include the following:
- Selling, General, and Administrative (SG&A)
- Research and Development (R&D)
- Sales and Marketing (S&M)
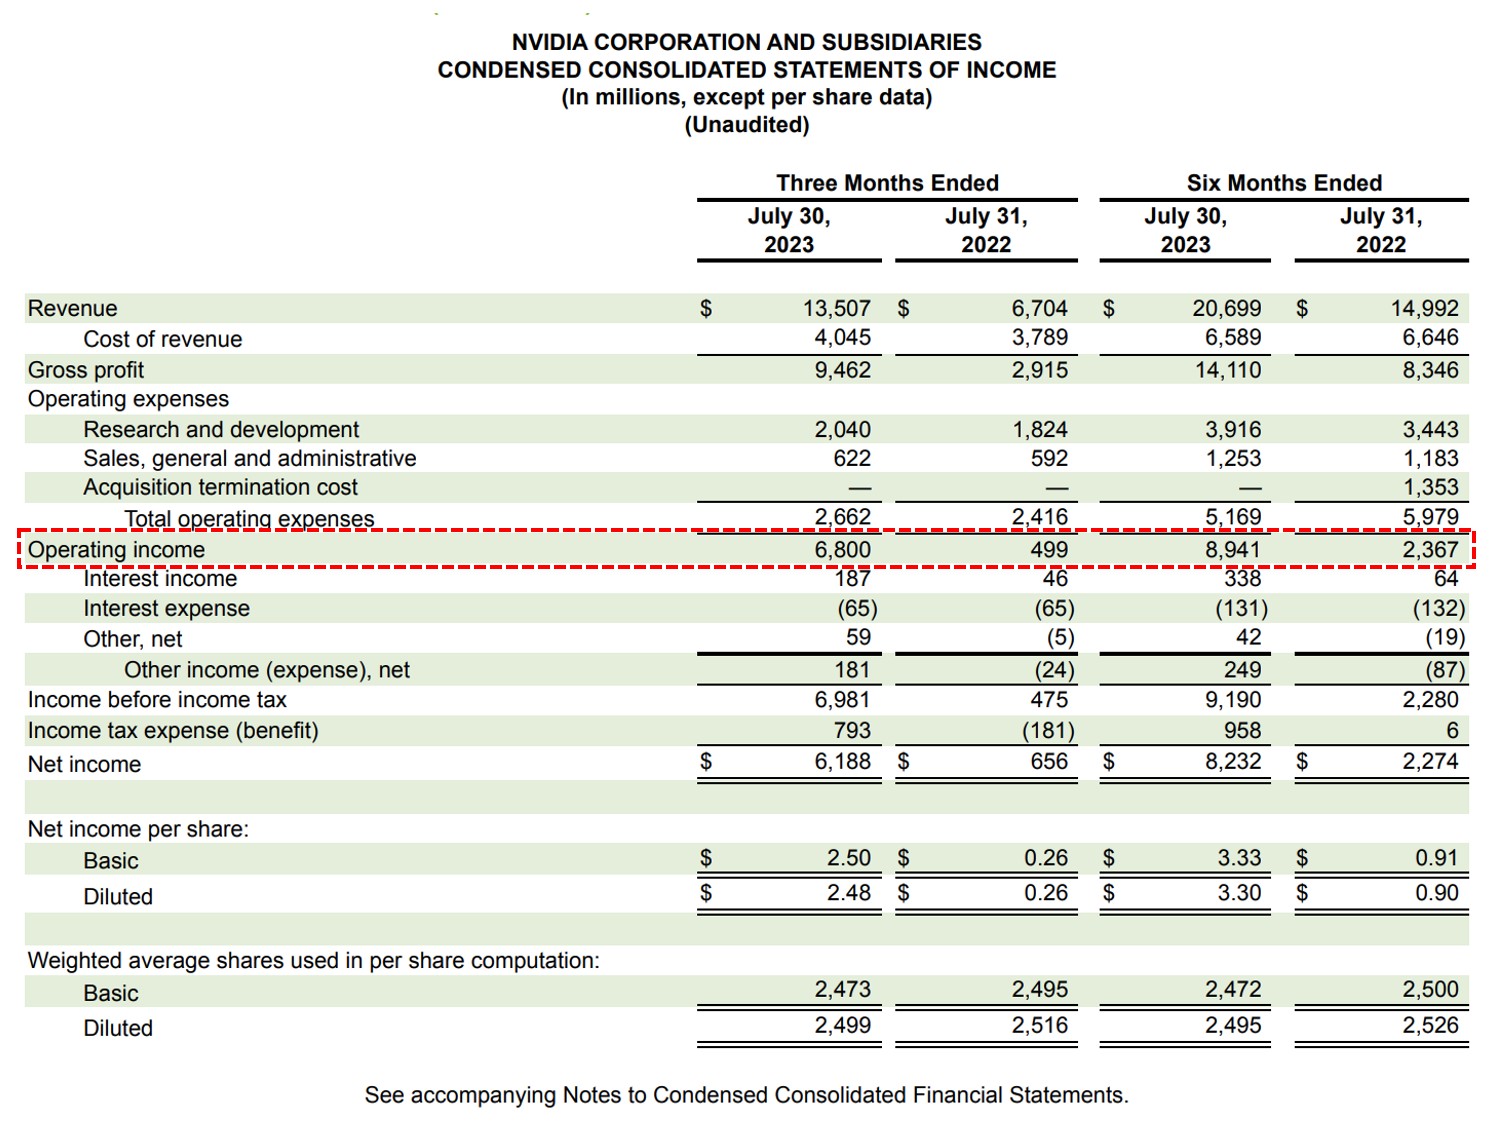
NVIDIA Income Statement, Q2-2023 (Source: NVDA 10-Q)
How to Calculate Operating Margin
Because the operating profit metric is not impacted by discretionary management decisions, the metric is widely used to analyze the operating performance of companies.
In particular, the operating profit is frequently used to compare the operating profitability of comparable companies. By itself, the operating profit of a company as a standalone metric is not suited for comparability purposes.
Instead, the profit metric must be standardized into a ratio, where the metric is converted into a percentage to facilitate comparisons.
The operating profit is also frequently used in valuation multiples. In fact, the operating profit metric and EBITDA are two of the most common valuation ratios used in comparable company analysis (CCA).
Why? The operating profit metric and EBITDA are each capital structure neutral metrics that measure the core operating performance of the companies.
Operating Profit vs. Net Profit: What is the Difference?
The operating profit and net profit of a company are two common measures of profitability in practice, with key differences:
- Operating Profit ➝ The operating profit metric, contrary to net profit, is unaffected by the capitalization of the company. Hence, the operating profit metric is frequently used as part of performing profitability analysis and in comps analysis involving valuation multiples.
- Net Profit ➝ The net profit metric, or net income (the “bottom line”), represents the accounting profitability of a company, inclusive of all operating and non-operating costs. Therefore, non-operating items such as interest expense and taxes impact a company’s net income, which can distort the metric as the financial metric does not solely isolate the operating performance of a company.
The formula to compute the net profit starting from operating profit is as follows.
Operating Profit Calculator
We’ll now move to a modeling exercise, which you can access by filling out the form below.
Operating Profit Calculation Example
Suppose we’re tasked with calculating the operating profit of NVIDIA Corporation (NASDAQ: NVDA) over its trailing six quarters.
| NVIDIA (NASDAQ: NVDA) | ||||||
|---|---|---|---|---|---|---|
| ($ in millions) | Q1-22 | Q2-22 | Q3-22 | Q4-22 | Q1-23 | Q2-23 |
| Revenue | $8,288 | $6,704 | $5,931 | $6,051 | $7,192 | $13,507 |
| Less: COGS | (2,857) | (3,789) | (2,754) | (2,218) | (2,544) | (4,045) |
| Gross Profit | $5,431 | $2,915 | $3,177 | $3,833 | $4,648 | $9,462 |
| Less: SG&A | (592) | (592) | (631) | (625) | (633) | (622) |
| Less: R&D | (1,618) | (1,824) | (1,945) | (1,952) | (1,875) | (2,040) |
| Operating Profit | $3,221 | $499 | $601 | $1,256 | $2,140 | $6,800 |
The first step is to subtract COGS from revenue, which results in NVIDIA’s gross profit for each quarter.
- Gross Profit, Q1-22 = $8,288mm + ($2,857mm) = $5,431mm (Gross Margin = 65.5%)
- Gross Profit, Q2-22 = $6,704mm + ($3,789mm) = $2,915mm (Gross Margin = 43.5%)
- Gross Profit, Q3-22 = $5,931mm + ($2,754mm) = $3,177mm (Gross Margin = 53.6%)
- Gross Profit, Q4-22 = $6,051mm + ($2,218mm) = $3,833mm (Gross Margin = 63.3%)
- Gross Profit, Q1-23 = $7,192mm + ($2,544mm) = $4,648mm (Gross Margin = 64.6%)
- Gross Profit, Q2-23 = $13,507mm + ($4,045mm) = $9,462mm (Gross Margin = 70.1%)
In the next step, the operating profit of NVIDIA can be determined by subtracting its gross profit from its two operating expenses, which are SG&A and R&D.
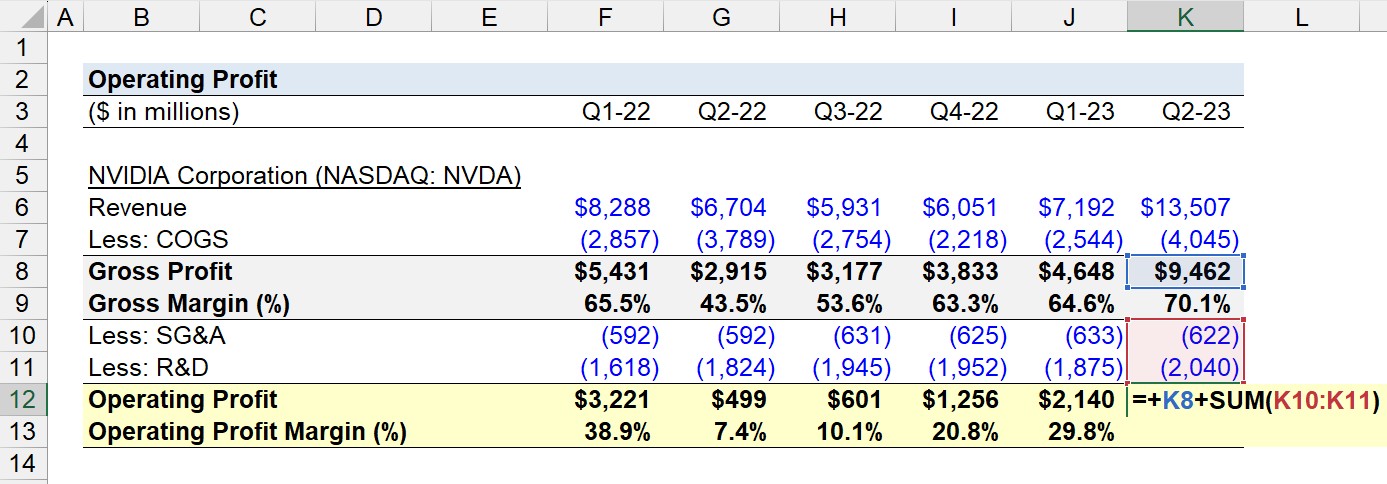
Upon subtracting NVIDIA’s reported gross profit from its operating expenses, we arrive at the following operating profits.
- Operating Profit, Q1-22 = $5,431mm + ($592mm) + ($1,618mm) = $3,221mm (Operating Margin = 38.9%)
- Operating Profit, Q2-22 = $2,915mm + ($592mm) + ($1,824mm) = $499mm (Operating Margin = 7.4%)
- Operating Profit, Q3-22 = $3,177mm + ($631mm) + ($1,945mm) = $601mm (Operating Margin = 10.1%)
- Operating Profit, Q4-22 = $3,833mm + ($625mm) + ($1,952mm) = $1,256mm (Operating Margin = 20.8%)
- Operating Profit, Q1-23 = $4,648mm + ($633mm) + ($1,875mm) = $2,140mm (Operating Margin = 29.8%)
- Operating Profit, Q2-23 = $9,462mm + ($622mm) + ($2,040mm) = $6,800mm (Operating Margin = 50.3%)
Therefore, NVIDIA’s operating profit in the trailing six historical quarters has exhibited substantial cyclicality each quarter, an inherent attribute of the semiconductor industry.
But in particular, Q2-23 was notably a robust quarter in operating profitability for NVIDIA, which was driven by the outsized demand for its AI chips in the market.


Everything You Need To Master Financial Modeling
Enroll in The Premium Package: Learn Financial Statement Modeling, DCF, M&A, LBO and Comps. The same training program used at top investment banks.
Enroll Today


