
- What is EBIT?
- How to Calculate EBIT
- EBIT Formula
- EBIT Calculation Example
- EBIT Margin Calculation Example
- What is a Good EBIT?
- EBIT vs. EBITDA: What is the Difference?
- EBIT Calculator — Excel Template
- 1. Operating Assumptions
- 2. Gross Profit Calculation Example
- 3. EBIT Calculation Example
- 4. EBIT Margin Calculation Example
What is EBIT?
EBIT—an abbreviation for “Earnings Before Interest and Taxes”—measures a company’s operating profitability in a period after deducting COGS and operating expenses.
EBIT is often used interchangeably with the term “operating income” and calculated by subtracting operating expenses (SG&A) from gross profit.

- EBIT is a company's operating profitability in a given period once COGS and operating expenses are deducted.
- The formula for calculating EBIT is gross profit minus operating expenses (SG&A, R&D).
- EBIT is a commonly used profitability metric for relative valuation and peer comparisons because it is unaffected by discretionary decisions such as debt financing, non-operating items, one-time corporate decisions, and taxes.
- EBIT is different from EBITDA in that the metric is recognized by GAAP accounting standards and reported on the income statement.
- Unlike EBITDA, EBIT does not add back depreciation and amortization (D&A).
How to Calculate EBIT
EBIT stands for “Earnings Before Interest and Taxes” and measures the operating profitability of a company in a specific period, with all core operating costs deducted from revenue.
On the income statement, operating income takes into account the following line items:
- Revenue ➝ The net sales generated by a company across a given period.
- Cost of Goods Sold (COGS) ➝ The direct costs incurred in the period that are closely tied to how revenue is produced.
- Operating Expenses (OpEx) ➝ The indirect costs incurred in the period that are not directly tied to revenue generation but integral to business operations.
Understanding the meaning of revenue (the “top line) should be relatively straightforward because the metric represents the net sales earned by a company from its operations, i.e. selling products and services to customers.
The operating costs of a company—the cost of goods sold (COGS) and operating expenses (OpEx)—are deducted from revenue to arrive at EBIT.
The distinction between COGS and operating expenses was mentioned earlier, but to reiterate, the former consists of direct costs, whereas the latter comprises indirect costs.
But the matter of importance here is that COGS and operating expenses (OpEx), such as selling, general and administrative (SG&A), research and development (R&D), and sales and marketing (S&M) are incurred as part of the company’s core operations.
In other words, the expenses recognized above the operating income line item are deemed “operating costs,” while the items recorded below the line, such as interest expense and taxes, are considered “non-operating costs”.
The step-by-step process to calculate EBIT is as follows:
- Step 1 ➝ Calculate Gross Profit (Revenue – COGS)
- Step 2 ➝ Calculate Total Operating Expenses (SG&A, R&D)
- Step 3 ➝ Subtract Operating Expenses from Gross Profit
EBIT Formula
Written out, the formula for calculating a company’s operating income (EBIT) is equal to gross profit minus operating expenses.
Where:
- Gross Profit = Revenue – Cost of Goods Sold (COGS)
- Operating Expenses = Σ Indirect Operating Costs
A company’s revenue is the starting line item on the income statement, while COGS is the first deduction from the “top line”, resulting in a company’s gross profit.
From a company’s gross profit, the next step is to subtract its operating expenses to arrive at the operating income line item.
The composition of a company’s operating expenses will vary by the specific circumstances (e.g. industry, cost structure), but the more common operating expenses are the following:
- Selling, General and Administrative (SG&A)
- Research and Development (R&D)
- Sales and Marketing (S&M)
EBIT Calculation Example
For example, suppose a publicly traded company reported the following financial data in 2024:
- Net Revenue = $25 million
- Cost of Goods Sold (COGS) = –$10 million
- Operating Expenses = –$5 million
The gross profit is equal to $15 million, from which we deduct $5 million in OpEx to calculate EBIT.
- Gross Profit = $25 million – $10 million = $15 million
- EBIT = $15 million – $5 million = $10 million
EBIT Margin Calculation Example
Continuing off our previous example, we can divide our company’s operating income by its revenue to calculate the operating margin.
Since the operating income is $10 million, we’ll divide that profit metric by our revenue of $25 million.
- EBIT Margin = $10 million ÷ $25 million = 40%
Since comparisons of standalone operating profit amounts are not meaningful, standardization is required, which is the purpose of multiples.
In our example, the operating margin is 40% — which means that for each dollar of revenue generated, $0.40 is retained and available for non-operating expenses.
The 40% margin can be compared against that of comparable peers, as well as with historical margins, to evaluate the financial performance of the company in question.
What is a Good EBIT?
Other than EBITDA, EBIT is likely the most commonly used profitability metric for relative valuation and peer comparisons.
Why? EBIT is unaffected by discretionary decisions, such as the following:
- Debt Financing (i.e. % of Total Capital Structure, Interest Expense Burden)
- Non-Core Income Sources (e.g. Interest Income)
- One-Time Corporate Decisions (e.g. Divestitures, Inventory, or PP&E Write-Downs)
- Taxes (i.e. Jurisdiction Dependent)
All relative valuation is skewed to some extent, but by using an unlevered metric like EBIT, a significant amount of flaws can be avoided.
It is important to note that one of the primary objectives of relative valuation is to compare the core operations of comparable companies as opposed to the non-core operations.
For example, let’s say that there are two companies with net margins of 40% and 20%, respectively.
However, the operating margins of the two companies could be much closer, as the cause of the 20% differential might be related to capital structure decisions (i.e. the company with 20% net margins might have undergone an LBO, so it incurs substantial interest expense each period).
By comparing the operating margin, these non-core differences are intentionally neglected to facilitate more meaningful comparisons among peer groups.
EBIT vs. EBITDA: What is the Difference?
To reiterate from earlier, EBIT and EBITDA are two of the most frequently used metrics for peer comparisons.
In short, EBITDA is a non-GAAP metric that adds back depreciation and amortization, among other discretionary adjustments.
Like EBIT, EBITDA removes the effect of capital structure decisions and taxes — however, depreciation and amortization (D&A) are added back since the expenses represent non-cash charges (and occasionally, stock-based compensation).
The formula to calculate EBITDA from EBIT simply adds back depreciation and amortization (D&A).
Both of the profit metrics are informative measures of a company’s profitability and operational performance.
Hence, the two operating metrics—EBITDA and EBIT—appear in the majority of comps sheets, where valuation multiples are presented.
For example, EV/EBITDA and EV/EBIT are two of the most common valuation multiples used in practice.
- EV/EBITDA = Enterprise Value ÷ EBITDA
- EV/EBIT = Enterprise Value ÷ EBIT
EBITDA is typically a larger amount than operating income because of the non-cash add-backs, with the difference becoming more apparent for capital-intensive industries (i.e. significant fixed assets on the balance sheet and, thus, outsized depreciation expense), which is an area of frequent criticism.
- GAAP Measure ➝ Another distinction between the two metrics is that operating income is a GAAP measure of profitability that is recognized on the income statement.
- Non-GAAP Measure ➝ On the other hand, EBITDA is a non-GAAP metric, and the reconciliation is usually shown separately in SEC filings, investor presentations, and equity research reports.
The EBIT of Alphabet Inc. (GOOGL) for Q-1 2023 and Q-1 2024 was $17.4 billion and $25.5 billion, respectively.
Note the line item is denoted as “Income from operations”, rather than EBIT or operating income.

EBIT Example on Income Statement (Source: Alphabet Inc. 2024 10-Q)
EBIT Calculator — Excel Template
We’ll now move to a modeling exercise, which you can access by filling out the form below.
1. Operating Assumptions
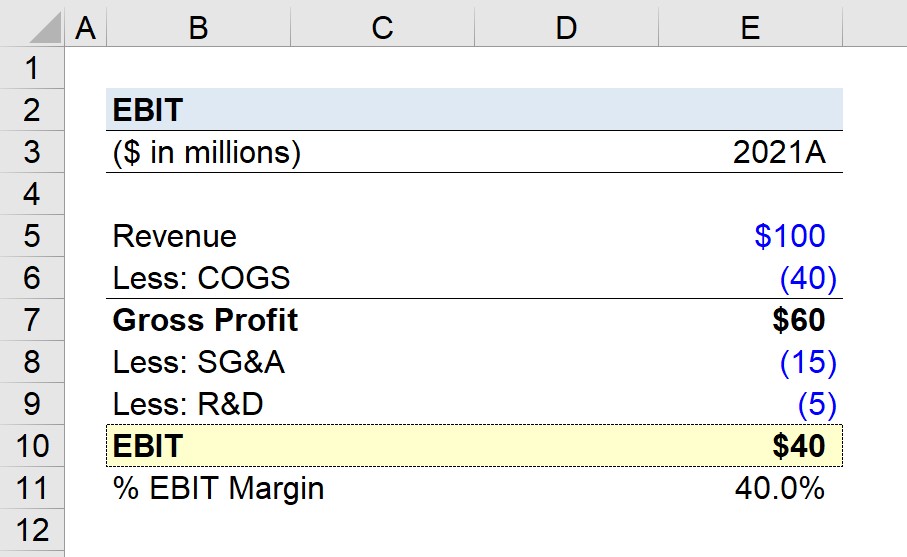
Suppose we’re given the income statement of a publicly traded company for the fiscal year ending 2021 and tasked with calculating its EBIT.
Starting from the company’s $100 million in revenue, the first step is to deduct COGS, which is stated as $40 million.
- Revenue = $100 million
- Cost of Goods Sold (COGS) = $40 million
The proportion of the company’s revenue that is allocated toward cost of goods sold (COGS) is 40%.
- COGS Margin (%) = $40 million ÷ $100 million = 40.0%
Therefore, for each dollar of revenue generated by the company, $0.40 is spent on COGS.
2. Gross Profit Calculation Example
The gross profit is equal to $60 million, which we calculated by subtracting COGS from revenue.
- Gross Profit = $100 million – $40 million = $60 million
Given the $60 million in gross profit, the gross margin comes out to 60%, i.e. for each dollar of revenue generated, $0.60 is kept as gross profit after deducting COGS.
- Gross Margin (%) = $60 million – $100 million = 60.0%
The gross margin is the inverse of the COGS margin, which we can easily confirm by adding the two percentages (40% + 60% = 1.0).
3. EBIT Calculation Example
From gross profit, we must now subtract the company’s operating expenses, wherein there are two types recorded.
- SG&A Expense = $15 million
- R&D Expense = $5 million
The total operating expense amounts to $20 million, which we’ll use to reduce gross profit and arrive at an EBIT of $40 million for our hypothetical company.
- Total Operating Expenses = $15 million + $5 million = $20 million
- EBIT = $60 million – $20 million = $40 million

4. EBIT Margin Calculation Example
In closing, we’ll divide our company’s EBIT by its revenue in the corresponding period to arrive at an EBIT margin of 40% to standardize the operating metric for purposes of comparability.
- EBIT Margin (%) = $40 million ÷ $100 million = 40%

Everything You Need To Master Financial Modeling
Enroll in The Premium Package: Learn Financial Statement Modeling, DCF, M&A, LBO and Comps. The same training program used at top investment banks.
Enroll Today


