Skip to main content
How to Use XNPV Function in Excel
The XNPV Function in Excel returns the net present value (NPV) of an investment with cash flows occurring at irregular intervals.
What is XNPV Function in Excel?
The XNPV function in Excel is a built-in feature that returns the net present value (NPV) of an investment given a series of cash flows and the specific dates on which the cash flows occur.
The net present value (NPV) is a fundamental concept in corporate finance most often used to guide capital budgeting decisions.
- NPV > 0: Accept Project (Profitable)
- NPV = 0: Neutral (Break Even)
- NPV < 0: Reject Project (Unprofitable)
Simply put, the net present value (NPV) of a potential investment, such as a potential project to pursue, is the net difference between the present value (PV) of future cash inflows and outflows.
- Cash Inflow: If the cash flow represents an inflow of cash (“source”), the value must be entered as a positive integer, e.g. project income or dividends.
- Cash Outflow: If the cash flow represents an outflow of cash (“use”), the value must be entered as a negative integer, e.g. the cost of an initial investment.
The present value (PV) of each future cash flow is a function of the discount rate and the date on which the cash flow occurs.
- Discount Rate: The discount rate is the opportunity cost of capital and represents the minimum rate of return required, i.e. the “hurdle rate” given the riskiness of the cash flows.
- Date: The time value of money (TVM) principle states that a dollar today is worth more than a dollar received on a later date. Thus, the further out a cash flow occurs in the future from the present date, the less valuable the cash flow is today.
Excel XNPV vs. NPV Function: What is the Difference?
The difference between the XNPV and NPV function in Excel is as follows.
- NPV Function in Excel: The NPV function, similar to the XNPV function, calculates the net present value of an investment. However, the default assumption in the NPV function is that all payments occur in equal time intervals, which limits its practicality since the cash flows are required to be periodic.
- XNPV Function in Excel: Unlike the NPV function, the XNPV function can handle irregular cash flows, where the timing of the cash flows is uneven. The specific dates corresponding to each cash flow are part of the syntax, reflecting that there is no preset assumption that the cash flows occur in periodic intervals.
XNPV Function Formula Syntax
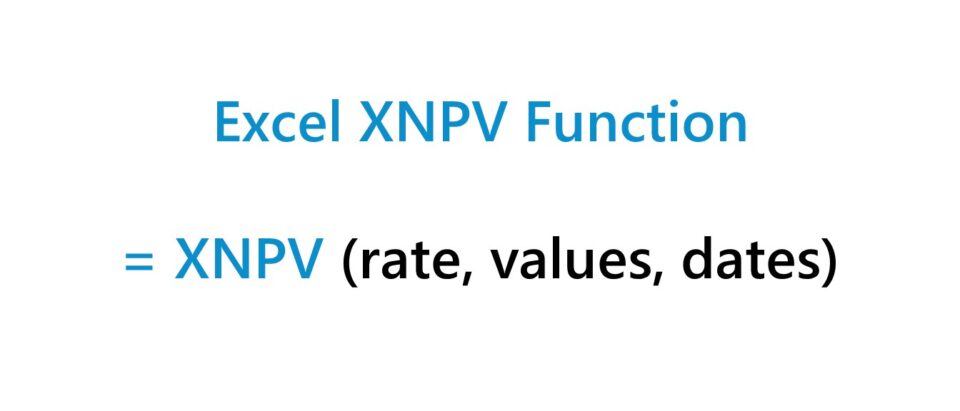
The formula to use the XNPV function in Excel is as follows.
- rate: The discount rate applied to the series of cash flows.
- values: The series of cash flows from the investment.
- dates: The specific dates on which the series of cash flows occur.
The array of values and dates must be equal in length since the purpose of the dates array is to identify the timing of each given cash flow.
The dates entered must be formatted properly, as well as valid dates, or else an error message appears.
XNPV Function Calculator – Excel Template
We’ll now move on to a modeling exercise, which you can access by filling out the form below.
XNPV Function Calculation Example
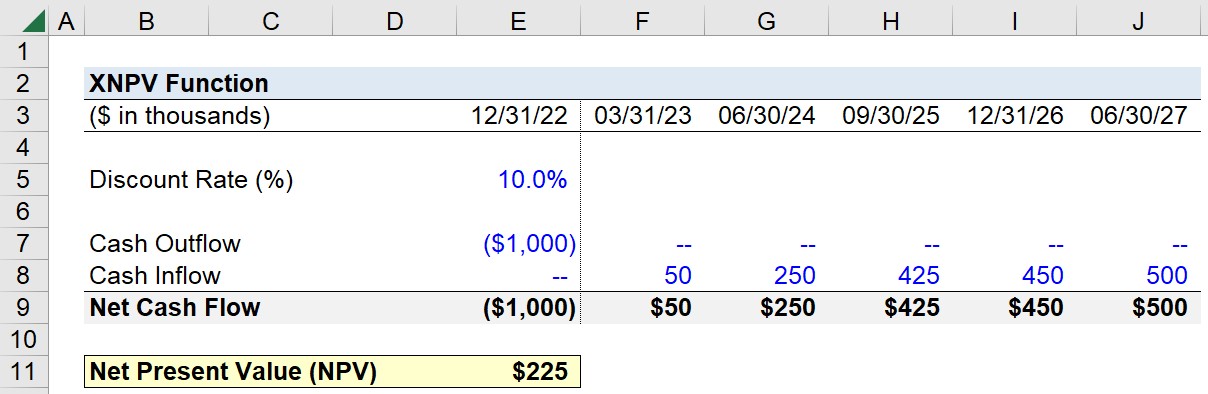
Suppose you’re tasked with calculating the net present value (NPV) of a project that costs $1 million in order to decide whether to accept or reject the investment.
If the project is accepted, the initial investment required is $1 million on 12/31/22.
- 12/31/22: ($1,000,000)
After the initial outlay, the anticipated income generated from the project and the corresponding dates are as follows.
- 03/31/23: +$50,000
- 06/30/24: +$250,000
- 09/30/25: +$425,000
- 12/31/26: +$450,000
- 06/30/27 : +$500,000
The only remaining input is the discount rate, i.e. the minimum rate of return required for the investment to be accepted, which we’ll assume is 10%.
- Discount Rate: 10.0%
Once the project’s cash inflows / (outflows) are entered into our spreadsheet, we’ll use the XNPV function to calculate the net present value (NPV) of the investment.
- rate: The first argument is the 10% discount rate, which we’ll link to (Cell E5).
- values: From there, the second argument is the array of net cash flows (E9:J9), which is the sum between the cash outflows and cash inflows.
- dates: The third and final argument is the array of dates that correspond to the array of cash flows (E3:J3)
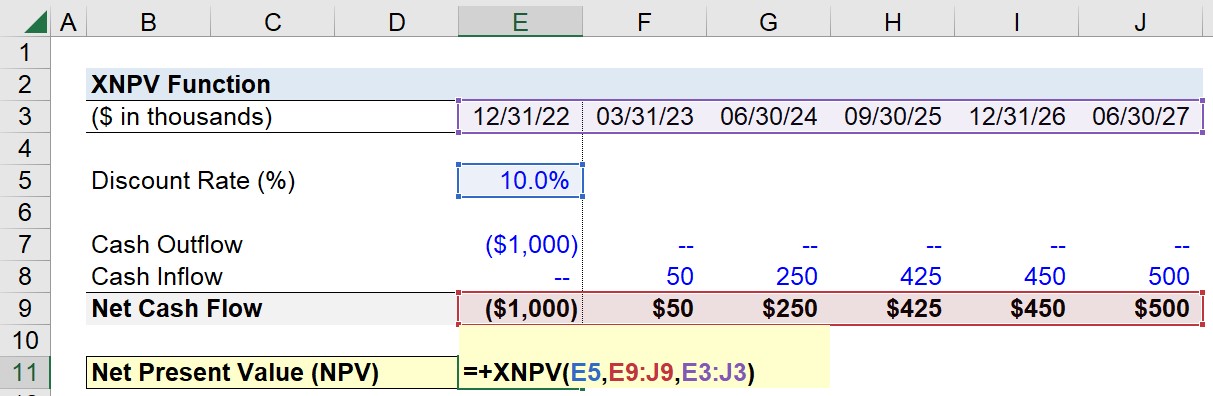
Upon entering our assumptions into the XNPV formula, we arrive at a net present value (NPV) of $225,000.
- Net Present Value (NPV) = $225,000
The implied net present value (NPV) determined using the XNPV function in Excel is positive, so the corporation is far more likely to accept the project since it is anticipated to be profitable (and create positive economic value).