Skip to main content
What is the YEARFRAC Function in Excel?
The YEARFRAC Function in Excel measures the fractional years between two specified dates, which is returned in the form of a decimal value.
How to Use YEARFRAC Function in Excel (Step-by-Step)
In Excel, the YEARFRAC function is a built-in feature used to determine the precise difference in time between two specified dates.
Since the primary use-case of the YEARFRAC function is to count the number of full days between a given starting and ending date—the resulting figure is a decimal value, i.e. the returned value is a fraction of the given year.
For instance, if the start date is the end of a fiscal year, or Q-4 (12/31/2021), and the end date is Q-1 (03/31/2022), the YEARFRAC function returns a value of 0.25, or 25%.
Note that if either the start or end date is formatted improperly (e.g. entered as a text string) or not as a valid date, the returned value will display a “#VALUE!” error message.
YEARFRAC Function Formula Syntax
The Excel YEARFRAC function formula is as follows.
Of the three arguments, only the first two are required, whereas the third is optional and can be omitted, as denoted by the brackets around “basis”.
- “start_date” → The opening parameter and date from which the function determines how far out the end date is.
- “end_date” → The closing parameter representative of the ending date to reach.
- “Basis” → The day count basis the function is to follow
If the “basis” input is omitted, the default day count basis convention in Excel is 30 /360 (30 day a month, 360 days a year).
- “0” → U.S. 30 /360
- “1” → Actual Days / Actual Days in Year
- “2” → Actual Days / 360
- “3” → Actual Days / 365
- “4” → European 30 / 360
YEARFRAC Function Calculator – Excel Model Template
We’ll now move on to a modeling exercise, which you can access by filling out the form below.
Excel YEARFRAC Function Calculation Example
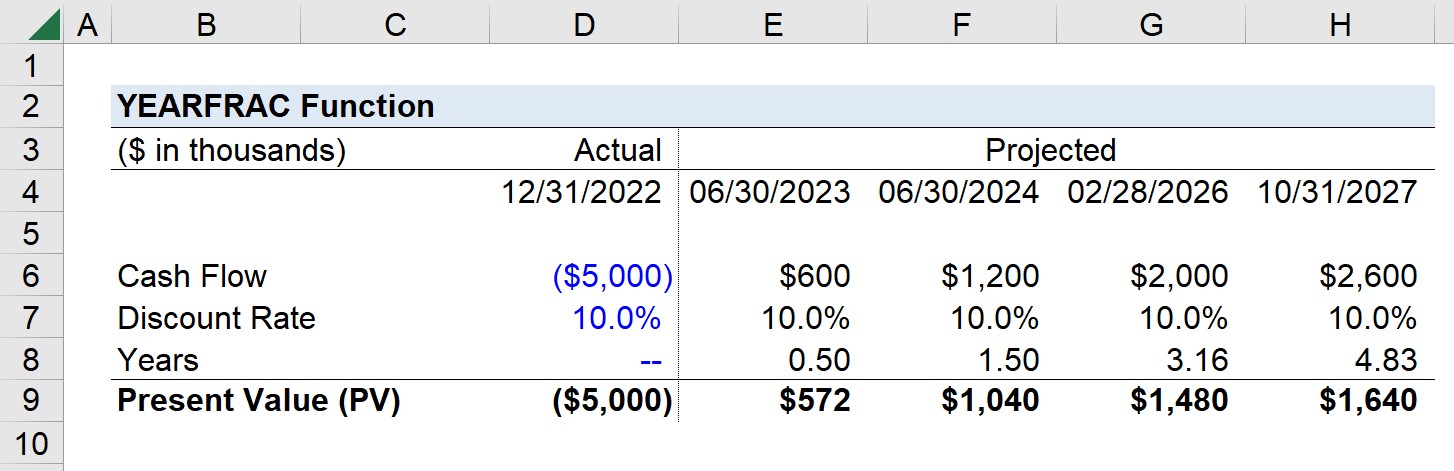
Suppose we’re tasked with calculating the present value (PV) of a series of cash flows generated by a new project undertaken by a company.
The project’s cash flows, however, occur at irregular periods, which is where the use-case of the YEARFRAC function comes in.
The initial outlay incurred by the company while setting up the project was $5 million on 12/31/2022, which we’ll assume is the present date on which the analysis is completed.
The table below shows the projected cash flows after the initial outflow (t = 0).
| 12/31/2022 | 06/30/2023 | 06/30/2024 | 02/28/2026 | 10/31/2027 |
|---|---|---|---|---|
| ($5 million) | $600k | $1.2 million | $2 million | $2.6 million |
Our discount rate assumption will be 8.0% and the present value (PV) formula involves dividing the cash flow by (1 + discount rate) and raising it to the power of the period number.
To calculate the period number—i.e. the difference between the date on which the cash flow is received and the present date—we’ll use the YEARFRAC function.
For example, the formula for calculating the time period of the first cash inflow of $600k received on 06/30/2023 is the following:
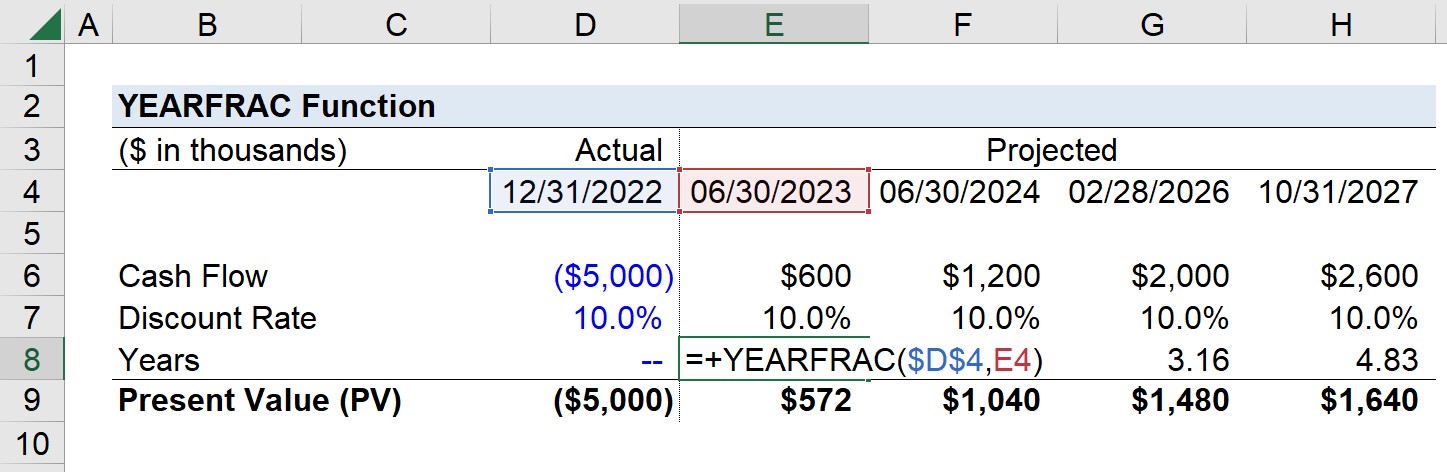
We’ll anchor the initial date cell (press F4) and copy the formula across the rest of the projection period.
- 06/30/2023 = 0.50
- 06/30/2024 = 1.50
- 02/28/2026 = 3.16
- 10/31/2027 = 4.83
For the initial two cash flows, we can see the difference from the present date is relatively standard, i.e. 6 months (half year) and 18 months (one and a half years) from the current date, respectively.
But for the latter two cash flows, the timing is more irregular in that those dates are 38 months and 58 months from the present date.
Once we plug our figures into the present value (PV) formula, we can calculate the discounted value of the project’s cash flows.