 Skip to main content
What is Gearing Ratio?
The Gearing Ratio measures a company’s financial leverage stemming from its capital structure decisions.
How to Calculate Gearing Ratio
The gearing ratio is a measure of a company’s capital structure, which describes how a company’s operations are financed with regard to the proportion of debt (i.e. the capital provided from creditors) vs. equity (i.e. the funding from shareholders).
Gearing ratios are useful for understanding the liquidity positions of companies and their long-term financial stability.
While debt carries the risk of bankruptcy, the reason companies still utilize leverage is that debt amplifies gains and losses, i.e. the added risk comes with the capacity for greater upside in gains if the borrowed capital is spent well.
In general, the cost of debt is viewed as a “cheaper” source of capital up to a certain point, as long as the default risk is kept to a manageable level.
The providers of debt financing are placed higher in terms of priority (i.e. relative to equity shareholders), so lenders are more likely to recover some (or all) of their original capital in the event of bankruptcy.
Moreover, the interest expense paid on debt issuances is tax-deductible, which creates the so-called “interest tax shield.”
Gearing Ratio Formula
The gearing ratio is often used interchangeably with the debt-to-equity (D/E) ratio, which measures the proportion of a company’s debt to its total equity.
The D/E ratio is a measure of the financial risk a company is subject to since excessive dependence on debt can lead to financial difficulties (and potentially default/bankruptcy).
The gearing ratio can also be an umbrella term for various leverage ratios.
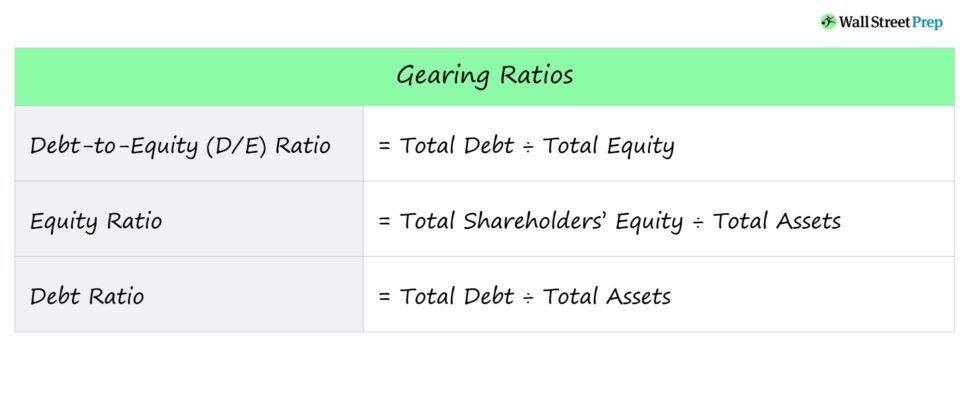
The formula for the debt-to-equity ratio is equal to total debt divided by total equity.
Conversely, the equity ratio is equal to total equity divided by total assets.
Lastly, the debt ratio is equal to total debt divided by total assets.
A brief description of each ratio is also provided below.
- Debt-to-Equity (D/E) Ratio → Perhaps the most common gearing ratio, the D/E ratio compares a company’s total debt obligations to its shareholders’ equity.
- Equity Ratio → The equity ratio refers to the proportion of a company’s assets that were funded using capital provided by equity shareholders.
- Debt Ratio → The debt ratio compares a company’s total debt obligations to its total assets, which can be informative with regard to how much of a company’s assets are funded by debt capital.
What is a Good Gearing Ratio?
A gearing ratio is a measure of financial leverage, i.e. the risks arising from a company’s financing decisions.
- High Financial Leverage → High Gearing Ratio
- Low Financial Leverage → Low Gearing Ratio
Lenders rely on gearing ratios to determine if a potential borrower is capable of servicing periodic interest expense payments and repaying debt principal without defaulting on their obligations.
Shareholders use gearing ratios to assess a company’s default risk, as well as its ability to efficiently derive value using the capital obtained, i.e. receiving a high return on the capital raised from debt or equity issuances.
Generally, the rule to follow for gearing ratios – most commonly the D/E ratio – is that a lower ratio signifies less financial risk.
- High Gearing Ratio → High Debt-to-Equity Ratio and Greater Financial Risk
- Low Gearing Ratio → Low Debt-to-Equity Ratio and Reduced Financial Risk
For the D/E ratio, capitalization ratio, and debt ratio, a lower percentage is preferable and indicates lower levels of debt and lower financial risk.
If a company were to have a high D/E ratio, the company’s reliance on debt financing to fund its continuing operations is significant.
In an economic downturn, such highly-levered companies typically face difficulties meeting their scheduled interest and debt repayment payments (and are at risk of bankruptcy).
In contrast, a higher percentage is typically better for the equity ratio.
Gearing Ratio Calculator – Excel Template
We’ll now move to a modeling exercise, which you can access by filling out the form below.
Gearing Ratio Calculation Example
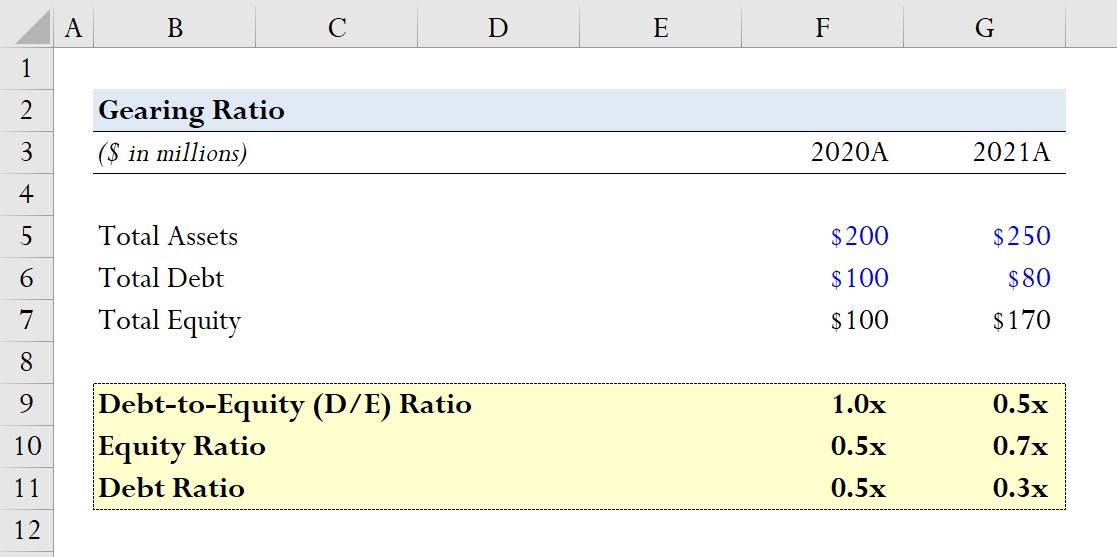
Suppose a company reported the following balance sheet data for fiscal years 2020 and 2021.
2020A
- Total Assets = $200 million
- Total Debt = $100 million
- Total Equity = $100 million
2021A
- Total Assets = $250 million
- Total Debt = $80 million
- Total Equity = $170 million
For each year, we’ll calculate the three aforementioned gearing ratios, starting with the D/E ratio.
D/E Ratio
- 2020A D/E Ratio = $100 million / $100 million = 1.0x
- 2021A D/E Ratio = $100 million / $100 million = 0.5x
Equity Ratio
- 2020A Equity Ratio = $100 million / $200 million = 0.5x
- 2021A Equity Ratio = $170 million / $250 million = 0.7x
Debt Ratio
- 2020A Debt Ratio = $100 million / $100 million = 0.5x
- 2021A Debt Ratio = $80 million / $250 million = 0.3x
From our modeling exercise, we can see how the reduction in debt (i.e. when the company relies less on debt financing) directly causes the D/E ratio to decline.
This trend is also reflected by the equity ratio increasing from 0.5x to 0.7x and the debt ratio declining from 0.5x to 0.3x.

Everything You Need To Master Financial Modeling
Enroll in The Premium Package: Learn Financial Statement Modeling, DCF, M&A, LBO and Comps. The same training program used at top investment banks.
Enroll Today


