 Skip to main content
- What is Solvency Risk?
- How Does Solvency Risk Work
- How to Calculate Solvency Risk?
- Solvency Ratio Formula
- What is a Good Solvency Ratio?
- Solvency vs. Liquidity Risk: What is the Difference?
- Solvency Risk Calculator | Excel Template
- 1. Balance Sheet Assumptions
- 2. Solvency Risk Ratio Analysis
- 3. Solvency Risk Calculation Example
What is Solvency Risk?
Solvency Risk measures the capacity of a company to meet its long-term financial obligations on time and continue operating as a “going concern”.

How Does Solvency Risk Work
The solvency risk of a company can fluctuate based on a variety of internal or external catalysts, such as an unexpected cash shortage due to underperformance or an unfavorable secular trend that necessitates significant spending to adjust to the new market conditions.
A sudden drop-off in operating performance or an unanticipated setback in meeting growth targets is seldom sufficient by itself to cause a company to become insolvent.
- Solvency → A solvent borrower can fulfill its long-term obligations on schedule, such as servicing interest expense and mandatory principal repayments on its long-term debt arrangements.
- Insolvency → An insolvent borrower, on the other hand, is unable to meet the required financial payments on time, which can lead to defaulting on the debt obligations and becoming distressed.
Solvency stems from long-term, sustainable financial stability, which is a function of a company’s operations consistently generating profits and ensuring its liabilities—namely long-term debt—are kept to a manageable level.
In particular, the over-reliance on raising capital by borrowing debt from lenders is by far the most common mistake that causes companies to become insolvent.
Given an unsustainable capital structure, the company’s free cash flows (FCFs) are inadequate to handle the debt burden and meet the required debt payments on time, nor does it have enough marketable liquid assets to sell off in the open markets.
Therefore, a company characterized by a low risk of insolvency tends to have the following three attributes:
- Stable Asset Base → Total Assets > Total Liabilities (i.e. Long-Term Debt Obligations)
- Optimal Capital Structure → Balance in Debt and Equity Financing Mix
- Profitable → Consistent Generation of Free Cash Flows (FCFs)
If the three conditions listed above are each met, the company is likely to comfortably meet its long-term obligations and be at a low risk of insolvency.
Solvency Definition Legal (Source: LII)
How to Calculate Solvency Risk?
Hypothetically, a company with a sub-1.0x solvency ratio can obtain enough liquidity to remain afloat and withstand a period of lackluster performance.
But regardless of the outcome, the odds are stacked against the company, and it is a high-risk position to be in, no matter the circumstances.
Of course, other credit ratios are used to determine the financial state of the company, such as the debt to equity ratio (D/E), debt to assets ratio (i.e. “debt ratio”), and the debt to capital ratio (or “capitalization ratio”)
- Debt to Equity Ratio = Total Debt ÷ Total Equity
- Debt to Asset Ratio = Total Debt ÷ Total Assets
- Debt to Capital Ratio = Total Debt ÷ Total Capitalization
In addition, interest coverage ratios can still be practical for gauging a company’s solvency risk, since the interest burden is a function of the outstanding long-term debt balance.
- Interest Coverage Ratio = EBIT ÷ Interest Expense
- EBITDA Coverage Ratio = EBITDA ÷ Total Debt
Coverage ratios focus on interest expense, which is the cost of financing frequently associated more with liquidity risk than solvency risk because of the periodic, recurring feature of interest until maturity. Hence, many perceive interest expense as a near-term expense, even if the payment schedule extends across a long time horizon.
Solvency Ratio Formula
There are numerous methods to measure the solvency of a company, starting with the ratio between a company’s total assets and total liabilities.
- Total Assets = Current Assets + Non-Current Assets
- Total Long-Term Debt (LTD) = Current Portion of Long Term Debt + Long Term Debt
What is a Good Solvency Ratio?
- Solvency Ratio > 1.0x → The higher the ratio, the lower risk of insolvency because more of the company’s assets exceed its liabilities.
- Solvency Ratio = 1.0x → The company’s total assets are equal to its total liabilities, so there is no margin for error regarding underperformance or an unexpected cash outflow.
- Solvency Ratio < 1.0x → The lower the ratio, the higher the risk of insolvency, as the company’s liabilities outweigh its asset base, i.e. the company is technically insolvent here.
Solvency vs. Liquidity Risk: What is the Difference?
- Solvency Risk → The capacity of a company to meet its long-term financial obligations on time (i.e. coming due in >12 months).
- Liquidity Risk → The ability of a company to meet its near-term financial obligations in a timely manner (i.e. coming due in <12 months).
Solvency Risk Calculator | Excel Template
We’ll now move on to a modeling exercise, which you can access by filling out the form below.
1. Balance Sheet Assumptions
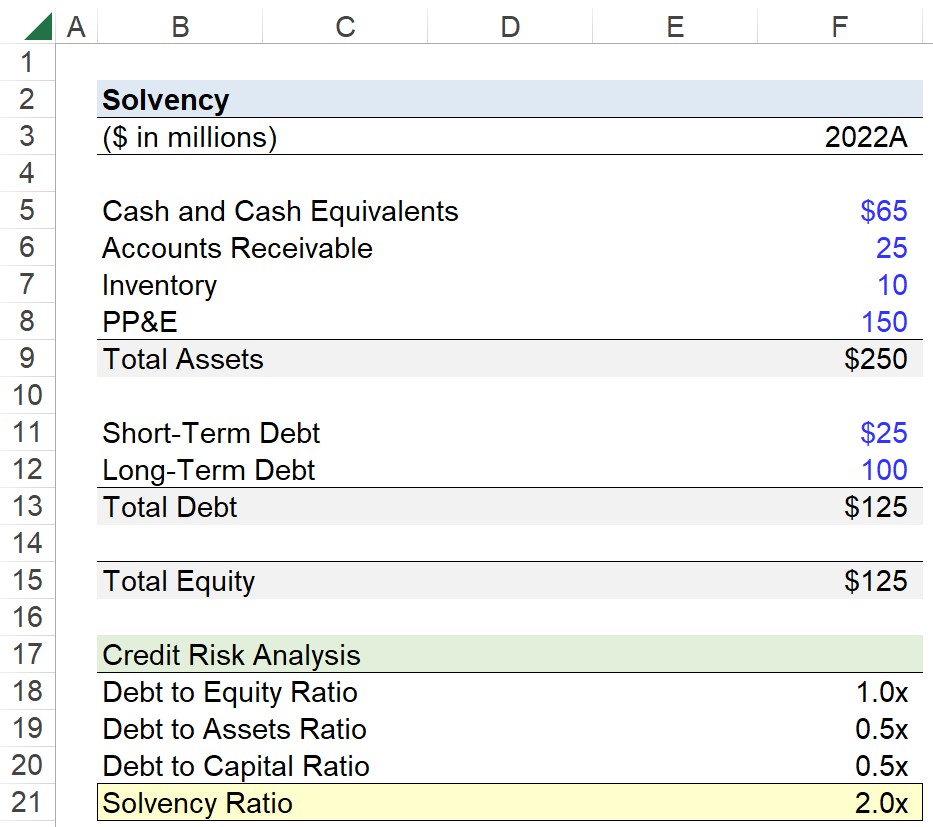
Suppose you’re tasked with measuring the solvency risk of a company given the following financial data for the latest fiscal year, 2022.
- Cash and Cash Equivalents = $65 million
- Accounts Receivable = $25 million
- Inventory = $10 million
- PP&E = $150 million
In total, the asset’s side of the balance sheet amounts to $250 million.
- Total Assets = $65 million + $25 million + $10 million + $150 million = $250 million
On the other side of the balance sheet, our company only has two liabilities, short-term debt and long-term debt.
While certain solvency ratio calculations will intentionally neglect short-term debt, we’ll assume that the short-term debt is the portion of the long-term debt coming due within twelve months (and thus counting it as long-term debt).
But even if the debt was actually an unrelated short-term debt security, there is no issue with its inclusion in order to be more risk-averse in the calculation, i.e. short-term liquidity risk is inevitably tied to long-term solvency risk.
The total debt is the sum of the two financial obligations, which comes out to $125 million.
- Short-Term Debt = $25 million
- Long-Term Debt = $100 million
- Total Debt = $25 million + $100 million = $125 million
Since we have the value of our company’s total assets and total liabilities, the difference is the total equity (i.e. assets = liabilities + equity).
- Total Equity = $250 million – $125 million = $125 million
2. Solvency Risk Ratio Analysis
In the next part of our exercise, we’ll calculate four balance sheet solvency ratios:
- Debt to Equity Ratio (D/E) = Total Debt ÷ Total Equity
- Debt to Assets Ratio = Total Debt ÷ Total Assets
- Debt to Capital Ratio = Total Debt ÷ Total Capitalization
- Solvency Ratio = Total Assets ÷ Total Long-Term Debt
To start, we’ll divide our company’s total debt by total equity to calculate the D/E ratio as 1.0x, i.e. the debt and equity balance are equivalent ($125 million).
- Debt to Equity Ratio (D/E) = $125 million ÷ $125 million = 1.0x
The next ratio is the debt to assets ratio, so we’ll divide our company’s debt by its total asset base, which is expectedly 0.5x. In other words, the company’s assets were financed evenly using 50% debt and 50% equity.
- Debt to Assets = $125 million ÷ $250 million = 0.5x
On to the next ratio—the debt to capital ratio—we’re comparing our total debt relative to the company’s total funding sources (i.e. debt + equity).
Therefore, the calculation of the debt to capital ratio should be intuitive, since we already understand the capital structure of our hypothetical company, i.e. the prior two calculations already established that 50% of the capital structure comprises debt.
- Debt to Capital = $125 million ÷ $250 million = 0.5x
3. Solvency Risk Calculation Example
In the final step, we’ll calculate the solvency ratio, which is equal to a company’s total assets divided by total long-term liabilities.
But to reiterate, there is no standardized formula for the solvency ratio, as most view it as a collection of multiple financial ratios, not just one.
Nonetheless, we’ll input the relevant data into our formula to arrive at a solvency ratio of 2.0x, which implies that the solvency risk of our company is on the lower side considering the fact that its total assets are worth twice the value of its total debt on its balance sheet.
- Solvency Ratio = $250 million ÷ $125 million = 2.0x

Everything You Need To Master Financial Modeling
Enroll in The Premium Package: Learn Financial Statement Modeling, DCF, M&A, LBO and Comps. The same training program used at top investment banks.
Enroll Today


