 Skip to main content
- What is Solvency Ratio?
- How to Calculate Solvency Ratio
- Solvency Ratio Formula
- What is the Difference Between Solvency Ratio vs. Liquidity Ratio?
- Solvency Ratio Calculator
- 1. Balance Sheet Assumptions
- 2. Debt to Equity Ratio Calculation Example (D/E)
- 3. Debt to Assets Ratio Calculation Example
- 4. Equity Ratio Calculation Example
- 5. Solvency Ratio Calculation Example
What is Solvency Ratio?
A Solvency Ratio assesses a company’s ability to meet its long-term financial obligations, or more specifically, the repayment of debt principal and interest expense.
When evaluating prospective borrowers and their financial risk, lenders and debt investors can determine a company’s creditworthiness by using solvency ratios.
How to Calculate Solvency Ratio
A solvency ratio assesses the long-term viability of a company – namely, if the financial performance of the company appears sustainable and if operations are likely to continue into the future.
- Liabilities ➝ Liabilities are defined as obligations that represent cash outflows, most notably debt, which is the most frequent cause of companies becoming distressed and having to undergo bankruptcy. If debt is added to a company’s capital structure, a company’s solvency is put at increased risk, all else being equal.
- Assets ➝ On the other hand, assets are defined as resources with economic value that can be turned into cash (e.g. accounts receivable, inventory) or generate cash (e.g. property, plant & equipment, or “PP&E”).
With that said, for a company to remain solvent, the company must have more assets than liabilities – otherwise, the burden of the liabilities will eventually prevent the company from staying afloat.
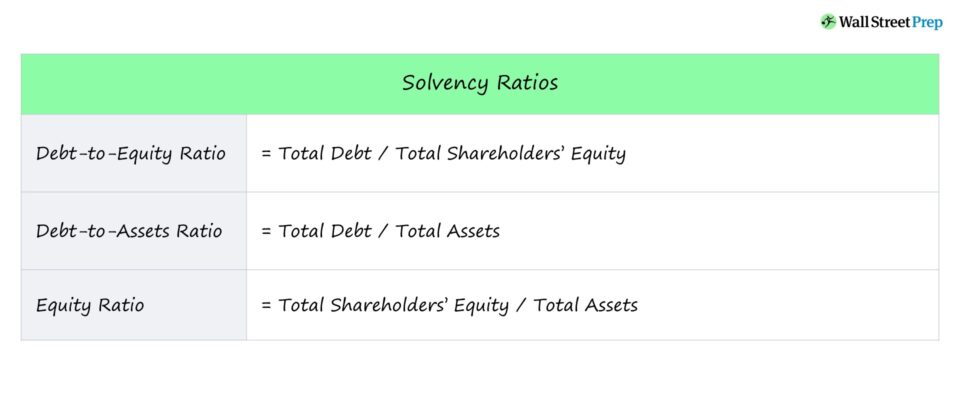
Solvency Ratio Formula
Solvency ratios compare the overall debt load of a company to its assets or equity, which effectively shows a company’s level of reliance on debt financing to fund growth and reinvest into its own operations.
In particular, the three most practical solvency ratios are as follows:
- Debt to Equity Ratio (D/E)
- Debt to Assets Ratio (D/A)
- Equity Ratio
Debt to Equity Ratio Formula (D/E)
The debt-to-equity ratio (D/E) compares a company’s total debt balance to the total shareholders’ equity account, which shows the percentage of financing contributed by creditors as compared to that of equity investors.
- High Debt to Equity Ratio (D/E) ➝ Higher D/E ratios mean a company relies more heavily on debt financing as opposed to equity financing – and therefore, creditors have a more substantial claim on the company’s assets if it were to be hypothetically liquidated.
- Debt to Equity Ratio (D/E) = 1.0x ➝ A D/E ratio of 1.0x means that investors (equity) and creditors (debt) have an equal stake in the company (i.e. the assets on its balance sheet).
- Low Debt to Equity Ratio (D/E) ➝ Lower D/E ratios imply the company is more financially stable with less exposure to solvency risk.
Debt to Assets Ratio Formula (D/A)
The debt-to-assets ratio compares a company’s total debt burden to the value of its total assets.
The debt-to-assets ratio evaluates whether the company has enough assets to satisfy all its obligations, both short-term and long-term – i.e. the debt-to-assets ratio estimates how much value in assets would be remaining after all the company’s liabilities are paid off.
- Low Debt to Assets Ratio ➝ Lower debt-to-assets ratios mean the company has sufficient assets to cover its debt obligations.
- Debt to Assets Ratio = 1.0x ➝ A debt-to-assets ratio of 1.0x signifies the company’s assets are equal to its debt – i.e. the company must sell off all of its assets to pay off its debt liabilities.
- High Debt to Assets Ratio ➝ Higher debt-to-assets ratios are often perceived as red flags, since the company’s assets are inadequate to cover its debt obligations.
If the total debt balance is outsized compared to the asset base, that implies the current debt burden is too much for the company to handle.
Like the debt-to-equity ratio, a lower ratio (<1.0x) is viewed more favorably, as it indicates the company is stable in terms of its financial health.
Equity Ratio Formula
The third solvency ratio we’ll discuss is the equity ratio, which measures the value of a company’s equity to its assets amount.
The equity ratio shows the extent to which the company’s assets are financed with equity (e.g. owners’ capital, equity financing) rather than debt.
In other words, if all the liabilities are paid off, the equity ratio is the amount of remaining asset value left over for shareholders.
- Higher Equity Ratio ➝ More equity relative to debt is viewed as more favorable since it means that more of the company is financed with equity, which implies that the company’s earnings and contributions from equity investors are funding its operations – as opposed to debt lenders.
- Lower Equity Ratio ➝ Less equity relative to debt signals that more assets were purchased with debt as the source of capital (i.e. implying the company carries a substantial debt load).
What is the Difference Between Solvency Ratio vs. Liquidity Ratio?
Both solvency and liquidity ratios are measures of leverage risk; however, the major difference lies in the time horizon covered by each metric.
- Liquidity Ratio ➝ Liquidity ratios are short-term oriented (i.e. current assets, short-term debt coming due in <12 months).
- Solvency Ratio ➝ In contrast, a solvency ratio takes on more of a long-term view, i.e. the sustainability of the company and ability to continue operating as a “going concern”.
Nevertheless, both ratios are closely related and provide important insights regarding the financial health of a company.
Solvency Ratio Calculator
We’ll now move to a modeling exercise, which you can access by filling out the form below.
1. Balance Sheet Assumptions
In our modeling exercise, we’ll begin by projecting a hypothetical company’s financials across a five-year time span.
Our company has the following balance sheet data as of Year 1, which is going to be held constant throughout the entirety of the forecast.
- Cash and Cash Equivalents = $50m
- Accounts Receivable (A/R) = $20m
- Inventory = $50m
- Property, Plant & Equipment (PP&E) = $100m
- Short-Term Debt = $10m
- Long-Term Debt = $40m
As of Year 1, our company has $120m in current assets and $220m in total assets, with $50m in total debt.
For illustrative purposes, we’ll assume the only liabilities that the company has are debt-related items, so the total equity is $170m – in effect, the balance sheet is in balance (i.e. assets = liabilities + equity).
For the rest of the forecast – from Year 2 to Year 5 – the short-term debt balance will grow by $5m each year, whereas the long-term debt will grow by $10m.
2. Debt to Equity Ratio Calculation Example (D/E)
The debt-to-equity ratio (D/E) is calculated by dividing the total debt balance by the total equity balance, as shown below.
In Year 1, for instance, the D/E ratio comes out to 0.3x.
- Debt-to-Equity Ratio (D/E) = $50m ÷ $170m = 0.3x
3. Debt to Assets Ratio Calculation Example
Next, the debt-to-assets ratio is calculated by dividing the total debt balance by the total assets.
For example, in Year 1, the debt-to-assets ratio is 0.2x.
- Debt-to-Assets Ratio = $50m ÷ $220m = 0.2x
4. Equity Ratio Calculation Example
As for our final solvency metric, the equity ratio is calculated by dividing total assets by the total equity balance.
In Year 1, we arrive at an equity ratio of 0.8x.
- Equity Ratio = $170m ÷ $220m = 0.8x
5. Solvency Ratio Calculation Example
From Year 1 to Year 5, the solvency ratios undergo the following changes.
- D/E Ratio: 0.3x → 1.0x
- Debt-to-Assets Ratio: 0.2x → 0.5x
- Equity Ratio: 0.8x → 0.5x
By the end of the projection, the debt balance is equal to the total equity (i.e. 1.0x), showing that the company’s capitalization is evenly split between creditors and equity holders on a book value basis.
The debt-to-assets ratio increases to approximately 0.5x, which means the company must sell off half of its assets to pay off all of its outstanding financial obligations.
And finally, the equity ratio declines to 0.5x from 0.8x, as the company is incurring more debt each year to finance the purchase of its assets and operations.


Everything You Need To Master Financial Modeling
Enroll in The Premium Package: Learn Financial Statement Modeling, DCF, M&A, LBO and Comps. The same training program used at top investment banks.
Enroll Today
")


The article says that low equity ratios are more favorable because the company used more equity than debt to fund the purchase of its assets. If the equation is Equity/Assets, wouldn’t a higher equity ratio suggest this and not a lower equity ratio?
Hi, Ethan,
You are correct, it seems they worded that backwards: higher equity ratios suggest less risk of insolvency, and lower equity ratios suggest greater risk of insolvency.
BB