 Skip to main content
- What is Debt to Equity Ratio?
- How to Calculate Debt to Equity Ratio (D/E)
- Debt to Equity Ratio Formula (D/E)
- What is a Good Debt to Equity Ratio?
- How to Interpret the D/E Ratio
- Debt to Equity Ratio Calculator (D/E)
- 1. Balance Sheet Assumptions
- 2. Debt to Equity Ratio Calculation Example
- 3. D/E Ratio Calculation Example
What is Debt to Equity Ratio?
The Debt to Equity Ratio (D/E) measures a company’s financial risk by comparing its total outstanding debt obligations to the value of its shareholders’ equity account.
How to Calculate Debt to Equity Ratio (D/E)
The debt-to-equity ratio (D/E) compares the total debt balance on a company’s balance sheet to the value of its total shareholders’ equity.
The D/E ratio represents the proportion of financing that came from creditors (debt) versus shareholders (equity).
- Debt → The debt component comprises any short-term borrowings, long-term debt, and any debt-like items on the company’s balance sheet
- Shareholders’ Equity → The equity component is inclusive of any equity contributed by the owners (i.e. founders), equity raised in the capital markets, and retained earnings.
In general, if a company’s D/E ratio is too high, that signals that the company is at risk of financial distress (i.e. at risk of being unable to meet required debt obligations).
However, a low D/E ratio is not necessarily a positive sign, as the company could be relying too much on equity financing, which is costlier than debt.
In addition, the reluctance to raise debt can cause the company to miss out on growth opportunities to fund expansion plans, as well as not benefit from the “tax shield” from interest expense.
Debt to Equity Ratio Formula (D/E)
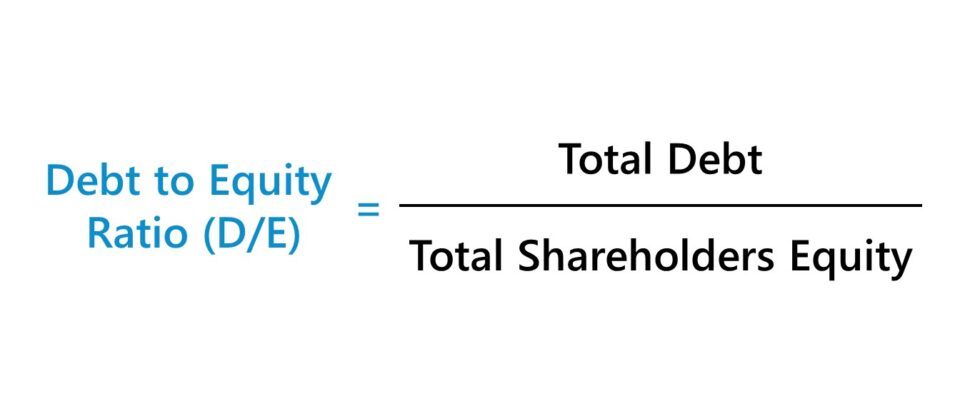
The formula for calculating the debt-to-equity ratio (D/E) is equal to the total debt divided by total shareholders equity.
Suppose a company carries $200 million in total debt and $100 million in shareholders’ equity per its balance sheet.
- Total Debt = $200 million
- Shareholders’ Equity = $100 million
Upon plugging those figures into our formula, the implied D/E ratio is 2.0x.
- D/E Ratio = $200 million / $100 million = 2.0x
Conceptually, the D/E ratio answers, “For each dollar of equity contributed, how much in debt financing is there?”
So, the debt-to-equity ratio of 2.0x indicates that our hypothetical company is financed with $2.00 of debt for each $1.00 of equity.
That said if the D/E ratio is 1.0x, creditors and shareholders have an equal stake in the company’s assets, while a higher D/E ratio implies there is greater credit risk due to the higher relative reliance on debt.
What is a Good Debt to Equity Ratio?
Lenders and debt investors prefer lower D/E ratios as that implies there is less reliance on debt financing to fund operations – i.e. working capital requirements such as the purchase of inventory.
By contrast, higher D/E ratios imply the company’s operations depend more on debt capital – which means creditors have greater claims on the assets of the company in a liquidation scenario.
For lenders, the existing debt on the balance sheet causes the borrower to be riskier to work with, especially for risk-averse debt lenders – and for shareholders, more debt means there are more claims on the company’s assets with higher priority than that of the shareholders.
Lenders and investors perceive borrowers funded primarily with equity (e.g. owners’ equity, outside equity raised, retained earnings) more favorably.
Under a hypothetical liquidation, including for creditors placed lower in the capital structure behind senior lenders, full recovery is not guaranteed – therefore, pre-existing creditors holding substantial claims on the company’s assets (and liens) increase the risk to creditors of lower seniority and equity holders.
How to Interpret the D/E Ratio
While not a regular occurrence, it is possible for a company to have a negative D/E ratio, which means the company’s shareholders’ equity balance has turned negative.
- Negative D/E Ratio → A negative D/E ratio means the company in question has more debt than assets.
- Positive D/E Ratio → A positive D/E ratio, on the other hand, implies the company has more assets than debt.
In the majority of cases, a negative D/E ratio is considered a risky sign, and the company might be at risk of bankruptcy. However, it could also mean the company issued shareholders significant dividends.
Debt to Equity Ratio Calculator (D/E)
We’ll now move to a modeling exercise, which you can access by filling out the form below.
1. Balance Sheet Assumptions
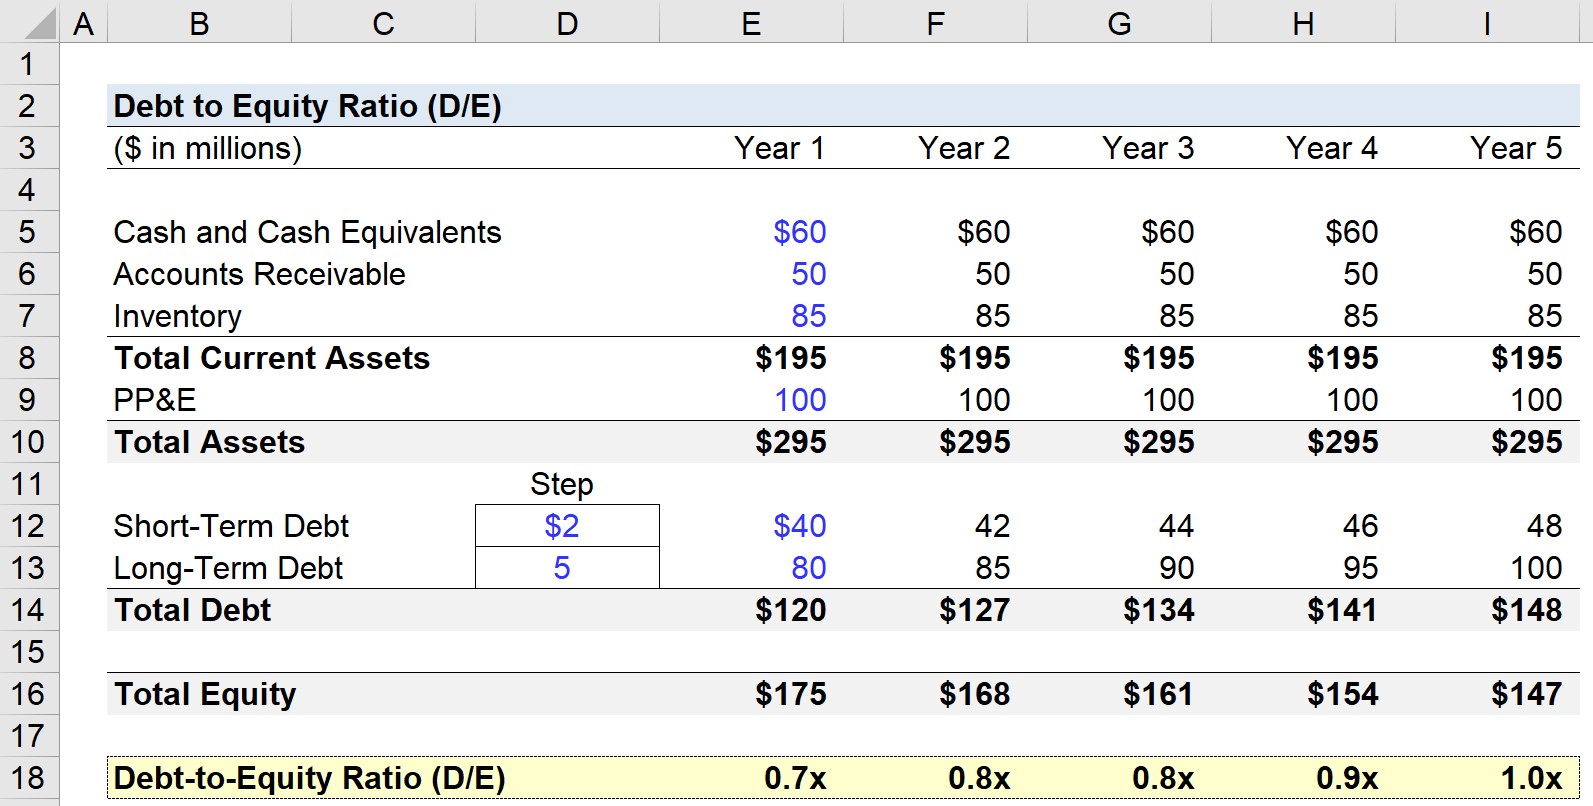
In our debt-to-equity ratio (D/E) modeling exercise, we’ll forecast a hypothetical company’s balance sheet for five years.
As of Year 1, the following assumptions will be used and extended across the entire projection period (i.e. held constant).
- Cash and Cash Equivalents = $60m
- Accounts Receivable = $50m
- Inventory = $85m
- Property, Plant & Equipment (PP&E) = $100m
- Short-Term Debt = $40m
- Long-Term Debt = $80m
From the above, we can calculate our company’s current assets as $195m and total assets as $295m in the first year of the forecast – and on the other side, $120m in total debt in the same period.
For purposes of simplicity, the liabilities on our balance sheet are only short-term and long-term debt.
Thus, the total equity in Year 1 is $175m for the balance sheet to remain in balance.
For the remainder of the forecast, the short-term debt will grow by $2m each year, while the long-term debt will grow by $5m.
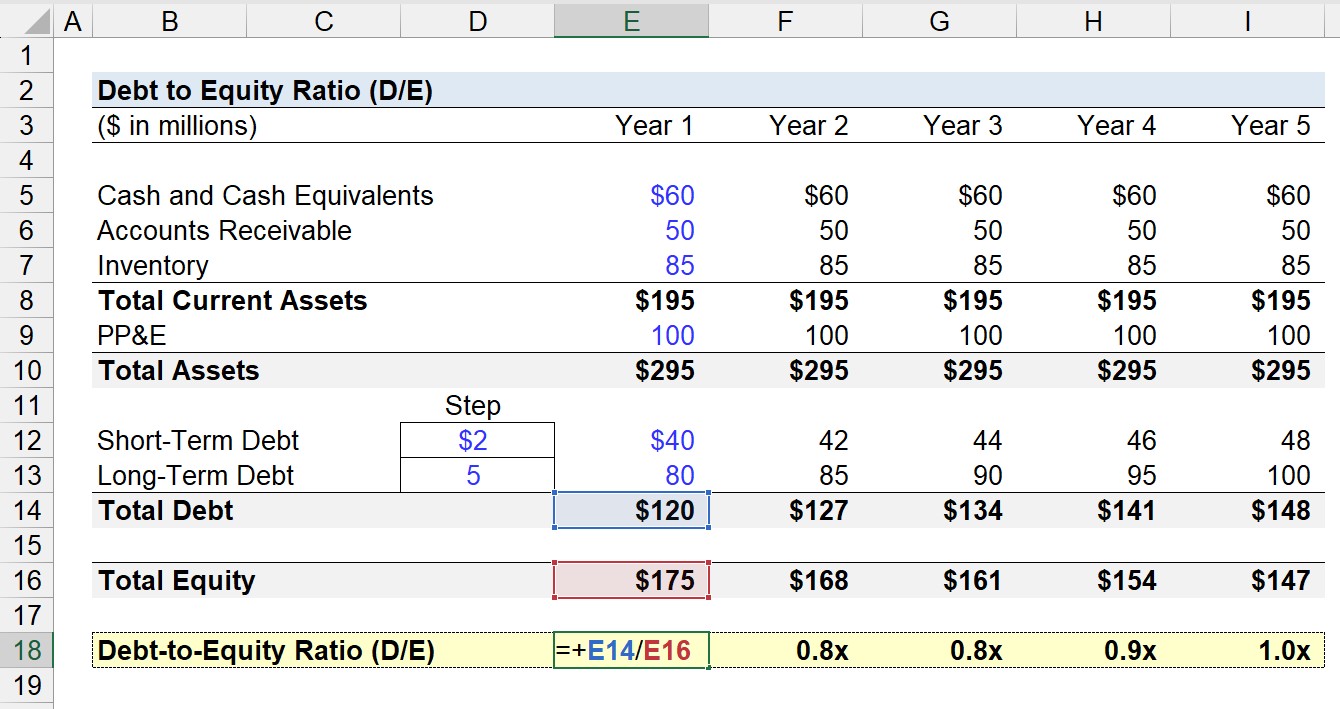
2. Debt to Equity Ratio Calculation Example
The debt-to-equity ratio (D/E) is calculated by dividing the total debt balance by the total equity balance.
In Year 1, for instance, the D/E ratio comes out to 0.7x.
- Debt to Equity Ratio (D/E) = $120m ÷ $175m = 0.7x
3. D/E Ratio Calculation Example
From Year 1 to Year 5, the D/E ratio increases each year until reaching 1.0x in the final projection period.
- D/E Ratio – Year 1 = 0.7x
- D/E Ratio – Year 2 = 0.8x
- D/E Ratio – Year 3 = 0.8x
- D/E Ratio – Year 4 = 0.9x
- D/E Ratio – Year 5 = 1.0x
Since the debt amount and equity amount are practically the same – $148m vs. $147m – the takeaway is the debt-to-equity ratio (D/E) in Year 5 implies that the value attributable to creditors and shareholders is equivalent according to the balance sheet.

Everything You Need To Master Financial Modeling
Enroll in The Premium Package: Learn Financial Statement Modeling, DCF, M&A, LBO and Comps. The same training program used at top investment banks.
Enroll Today
")

")


Excellent explanation