 Skip to main content
What is Debt to Asset Ratio?
The Debt to Asset Ratio, or “Debt Ratio”, is a solvency ratio used to determine the proportion of a company’s assets funded by debt rather than equity.
How to Calculate Debt to Asset Ratio
The debt ratio, also known as the “debt to asset ratio”, compares a company’s total financial obligations to its total assets in an effort to gauge the company’s chance of defaulting and becoming insolvent.
The two inputs for the formula are defined below.
- Total Debt: The short-term or long-term borrowings such as loans provided by banks, corporate bond issuances, mortgages, and any interest-bearing security with debt-like features.
- Total Assets: The resources with positive economic value, i.e. can be sold for monetary value such as cash, represents future payments from customers (i.e. accounts receivable), or be used to create future revenue like PP&E.
Once computed, the company’s total debt is divided by its total assets.
Conceptually, the total assets line item depicts the value of all of a company’s resources with positive economic value, but it also represents the sum of a company’s liabilities and equity.
The fundamental accounting equation states that at all times, a company’s assets must equal the sum of its liabilities and equity.
Therefore, comparing a company’s debt to its total assets is akin to comparing the company’s debt balance to its funding sources, i.e. liabilities and equity.
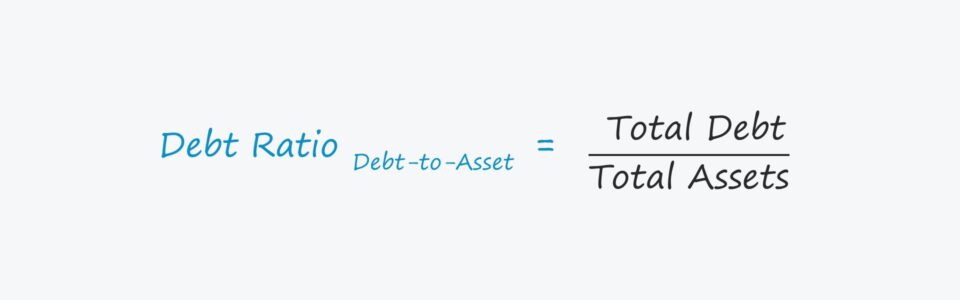
Debt to Asset Ratio Formula
The formula to calculate the debt ratio is equal to total debt divided by total assets.
What is a Good Debt to Asset Ratio?
If hypothetically liquidated, a company with more assets than debt could still pay off its financial obligations using the proceeds from the sale.
All else being equal, the lower the debt ratio, the more likely the company will continue operating and remain solvent.
Conversely, a company with fewer assets than debt would not have the option to do so, causing restructuring to be necessary, which could end in liquidation, i.e. the distressed company undergoes a liquidation process and the proceeds from the sale are distributed to claim holders in the order of priority.
That said, the following are the general rules of thumb for interpreting the ratio:
- Debt Ratio < 1x ➝ The company’s assets are enough to pay off all outstanding debt obligations.
- Debt Ratio = 1x ➝ The company’s assets are equal to its debt, so there is clearly a large amount of leverage being used (i.e. must sell all assets to cover all outstanding debts).
- Debt Ratio > 1x ➝ The debt burden outweighs the company’s assets, which is a sign of impending financial trouble as there is no “cushion” for underperformance.
Debt Ratio by Industry
As is often the case, comparisons of the debt ratio among different companies are meaningful only if the companies are similar, e.g. of the same industry, with a similar revenue model, etc.
For example, the debt ratio of a utility company is in all likelihood going to be higher than a software company – but that does not mean that the software company is less risky.
Debt to Asset Ratio Calculator
We’ll now move to a modeling exercise, which you can access by filling out the form below.
Step 1. Capital Structure Assumptions
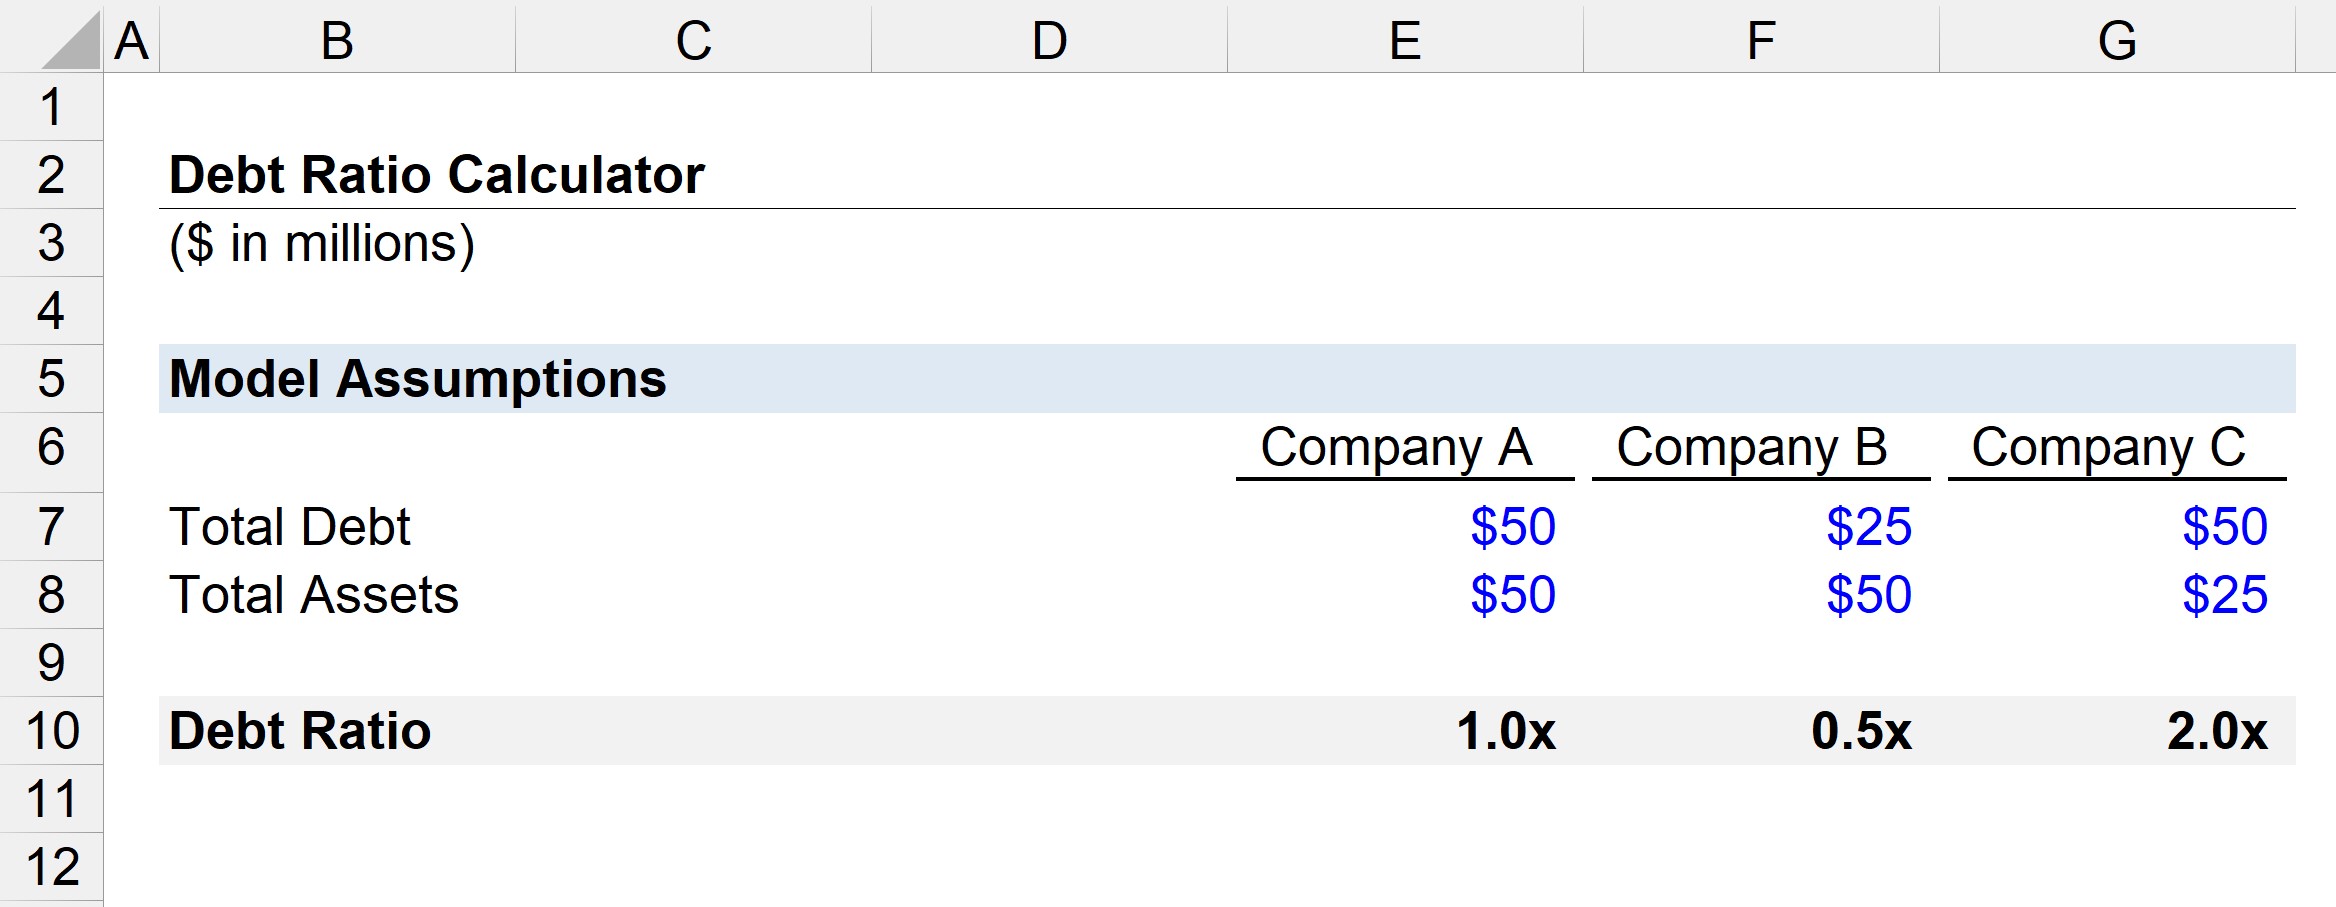
Suppose we have three companies with different debt and asset balances.
Company A:
- Debt = $50 million (50%)
- Assets = $50 million (50%)
Company B:
- Debt = $25 million (33.3%)
- Assets = $50 million (66.6%)
Company C:
- Debt = $50 million (66.6%)
- Assets = $25 million (33.3%)
Step 2. Debt to Asset Ratio Calculation Example
Given those assumptions, we can input them into our debt ratio formula.
- Company A = $50 million ÷ $50 million = 1.0x
- Company B = $25 million ÷ $50 million = 0.5x
- Company C = $50 million ÷ $25 million = 2.0x
From the calculated ratios above, Company B appears to be the least risky considering it has the lowest ratio of the three.
On the opposite end, Company C seems to be the riskiest, as the carrying value of its debt is double the value of its assets.

Everything You Need To Master Financial Modeling
Enroll in The Premium Package: Learn Financial Statement Modeling, DCF, M&A, LBO and Comps. The same training program used at top investment banks.
Enroll Today


