
What is Degree of Financial Leverage?
Degree of Financial Leverage (DFL) quantifies the sensitivity of a company’s net income (or EPS) to changes in its operating profit (EBIT) attributable to debt financing.
How to Calculate Degree of Financial Leverage (DFL)
The degree of financial leverage (DFL) is a financial metric that measures the sensitivity of the net income (or earnings per share, EPS) of a company to fluctuations in its operating income (EBIT) as caused by reliance on debt financing, or “leverage”.
Financial leverage refers to the costs of financing — e.g. interest expense — funding a company’s reinvestment needs like working capital and capital expenditures (Capex).
Companies can finance the purchase of assets using two sources of capital:
- Equity Capital → Equity Issuances, Retained Earnings, Paid-in Capital
- Debt Capital → Debt Issuances (e.g. Corporate Bonds, Bank Loans)
Debt financing comes with fixed financial costs – i.e. periodic interest expense obligations and principal amortization – that must be fulfilled, regardless of a company’s performance in a given period.
The higher the degree of financial leverage (DFL), the more volatile a company’s net income (or EPS) will be — all else being equal.
Like operating leverage, financial leverage amplifies the potential returns from positive growth, as well as the losses from declining growth.
- Growth in EBIT → Increased Growth in Net Income
- Decline in EBIT → Increased Losses in Net Income
The degree of financial leverage (DFL) is a measure of financial risk, i.e. the potential losses from the presence of leverage in a company’s capital structure.
DFL is used to understand the relationship between two variables:
- Earnings Before Interest and Taxes (“EBIT”) → EBIT, or “operating income”, refers to the earnings before interest and taxes of a company.
- Earnings Per Share (EPS) → EPS, an abbreviation for “earnings per share”, is the net earnings of a company divided by its total number of shares outstanding.
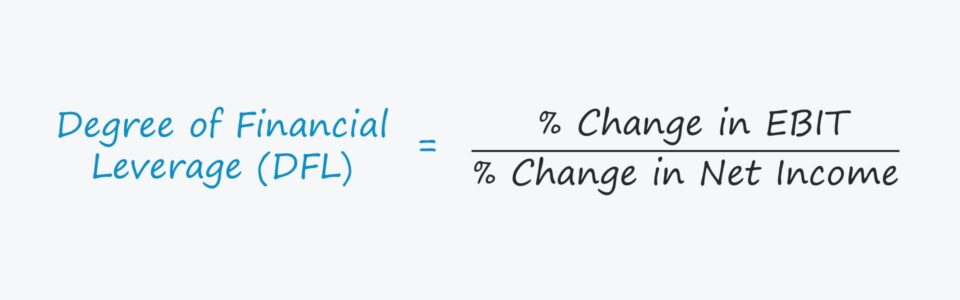
Degree of Financial Leverage Formula (DFL)
The degree of financial leverage (DFL) refers to the sensitivity of a company’s net income — i.e. the cash flows available to equity shareholders — if its operating income were to change.
The formula for the degree of financial leverage compares the % change in net income (or earnings per share, “EPS”) relative to the % change in operating income (EBIT).
Alternatively, DFL can be calculated using earnings per share (EPS) rather than net income.
For example, assuming that a company’s DFL is 2.0x, a 10% increase in EBIT should result in a 20% rise in net income.
What are the DFL Formula Components?
A more in-depth process of calculating the degree of financial leverage (DFL) comprises the following five steps.
- Multiply Quantity Sold by (Unit Price × Variable Cost Per Unit)
- Subtract Fixed Costs from (1) → Numerator
- Multiply Quantity Sold by (Unit Price × Variable Cost Per Unit)
- Subtract Fixed Costs and Fixed Financial Costs from (3) → Denominator
- Divide the Numerator (2) by the Denominator (4)
If we combine those steps into a formula, we are left with the following for the formula to calculate the degree of financial leverage (DFL).
Where:
- Q = Quantity Sold
- P = Unit Price
- V = Variable Cost Per Unit
- FC = Fixed Costs
- I = Interest Expense (Fixed Financial Costs)
Degree of Financial Leverage Calculator (DFL)
We’ll now move to a modeling exercise, which you can access by filling out the form below.
Degree of Financial Leverage Calculation Example
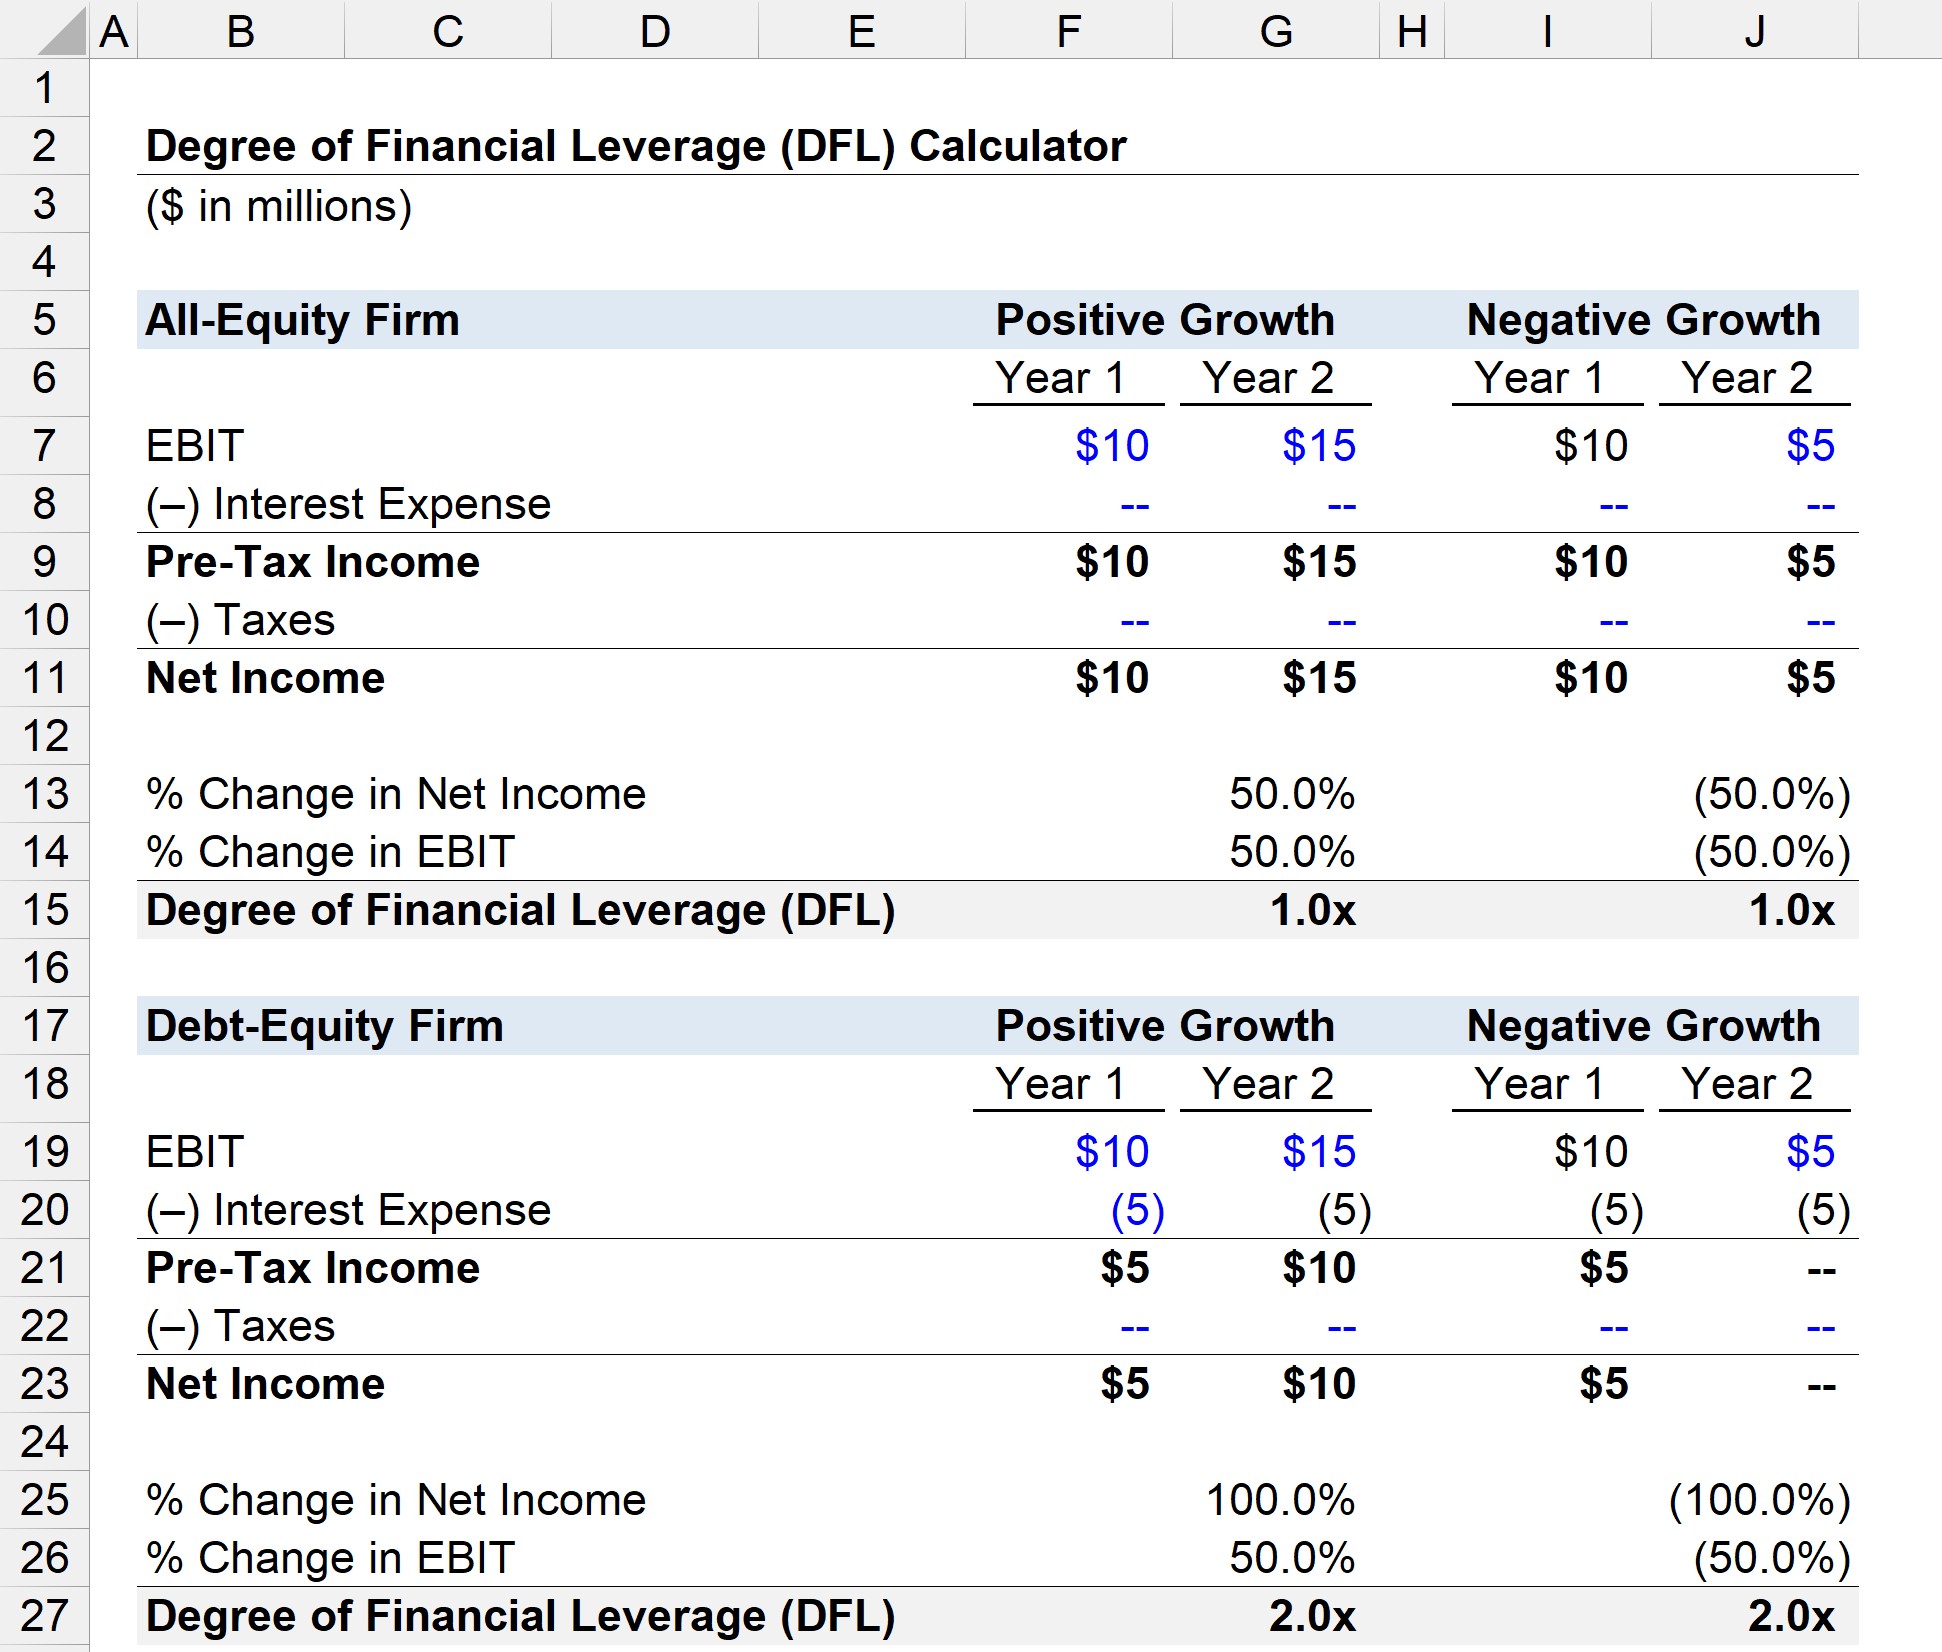
Suppose we have two virtually identical companies with just one exception — one is an all-equity firm whereas the other company has a capital structure with a mixture of debt and equity.
- All-Equity Firm → No Debt
- Debt-Equity Firm → $50 million Debt @ 10% Interest Rate
In Year 1, the two companies both brought in $10 million in operating income (EBIT).
As for Year 2, we’ll assess the degree of financial leverage under two cases.
- Positive Growth → Year 2 EBIT Increases by 50%
- Negative Growth → Year 2 EBIT Declines by 50%
That being said, the Year 2 EBIT values are as follows.
- Positive Growth → Year 2 EBIT = $15 million
- Negative Growth → Year 2 EBIT = $5 million
The next step is to calculate the pre-tax income, which requires deducting the annual interest expense.
For the all-equity firm, the pre-tax income is equal to EBIT because there is no debt in the company’s capital structure.
But for the debt-equity firm, the interest expense is equal to the $50 million in debt multiplied by the 10% interest rate, which comes out to $5 million.
- Interest Expense = $50 million × 10% = $5 million
The $5 million interest expense can be extended across the two-year periods in both scenarios, as interest is a “fixed” cost, i.e. whether the company performs well or underperforms, the interest due remains unchanged.
The final line item to deduct from pre-tax income before reaching net income is taxes, which we’ll assume is equal to zero for the sake of isolating the impact of leverage.
After that, we’ll calculate the % change in net income and % change in EBIT — the two inputs in our DFL formula — for all four sections.
- % Change in Net Income = (Year 2 Net Income ÷ Year 1 Net Income) – 1
- % Change in EBIT = (Year 2 EBIT ÷ Year 1 EBIT) – 1
If we divide the % change in net income by the % change in EBIT, we can calculate the degree of financial leverage (DFL).
All-Equity Firm
- DFL – Positive Growth = 50% ÷ 50% = 1.0x
- DFL – Negative Growth = –50% ÷ –50% = 1.0x
Debt-Equity Firm
- DFL – Positive Growth = 100% ÷ 50% = 2.0x
- DFL – Negative Growth = –100% ÷ –50% = 2.0x
From our illustrative example, we can see when a company exhibits positive growth in EBIT, debt financing contributes towards greater net income growth (1.0x vs. 2.0x).
However, the same impact on our hypothetical company’s degree of financial leverage (DFL) is seen under negative growth, just in the opposite direction (i.e. the leverage causes greater losses).
Therefore, companies must be cautious when adding debt into their capital structure, as both the favorable and unfavorable effects are magnified.

Everything You Need To Master Financial Modeling
Enroll in The Premium Package: Learn Financial Statement Modeling, DCF, M&A, LBO and Comps. The same training program used at top investment banks.
Enroll Today


