 Skip to main content
- What is Financial Leverage?
- How to Calculate Financial Leverage?
- Financial Leverage Formula
- What is a Good Financial Leverage Ratio?
- How to Analyze Financial Leverage
- What are the Risks of Financial Leverage?
- How Does Financial Leverage Affect Net Income and EPS?
- Financial Leverage Calculator — Excel Template
- Financial Leverage Calculation Example
What is Financial Leverage?
Financial Leverage refers to the borrowing of capital by a corporation from lenders, such as banks, to fund its operations and long-term investments in fixed assets (PP&E).
By using borrowed funds to fund working capital needs and purchase fixed assets (PP&E)—or capital expenditures (Capex)—a company can increase its asset base and generate higher returns without incurring significant cash outflows.
How to Calculate Financial Leverage?
Financial leverage refers to a corporation borrowing capital from lenders to meet its recurring, operational spending needs and capital expenditures (Capex).
From the perspective of corporations, there are two sources of capital available.
- Equity Capital ➝ The common shares issued by a company to raise capital from investors. Each share represents partial ownership of the total equity of the underlying issuer. Unlike lenders, shareholders are not entitled to receive dividends.
- Debt Capital ➝ Debt securities, such as loans and bonds, are borrowing arrangements in exchange for periodic interest and principal payments. The interest rate on the debt and remaining principal determines the size of the interest payments owed to the lender.
In short, financial leverage is a source of funding used by a company to meet working capital requirements and acquire fixed assets (PP&E) for its core operating activities that generate its revenue to sustain itself, without the need to raise equity (i.e. “trading on equity”).
The reason financial leverage matters is because debt enables firms to potentially achieve higher returns, benefit from the tax-deductibility of interest, and have more capital available to allocate toward growth and expansion opportunities.
Financial Leverage Formula
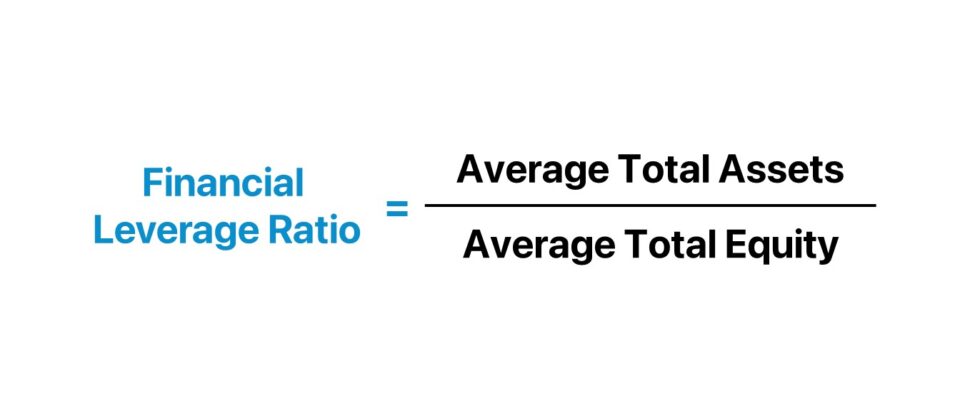
The formula to calculate the financial leverage ratio divides a company’s average total assets to its average shareholders’ equity.
Where:
- Average Total Assets = (Beginning + Ending Total Assets) ÷ 2
- Average Shareholders’ Equity = (Beginning + Ending Total Equity) ÷ 2
The two inputs, “Total Assets” and “Total Shareholders’ Equity” are each found on the balance sheet of a company.
The financial leverage ratio reflects the proportion of a company’s assets funded by debt, rather than equity.
The financial leverage ratio answers, “How much of a company’s assets were financed by debt?”
What is a Good Financial Leverage Ratio?
In practice, the financial leverage ratio is used to analyze the credit risk of a potential borrower, most often by lenders.
As a general guideline, the lower the financial leverage ratio, the less debt on the borrower’s balance sheet (and less credit risk).
- Lower Financial Leverage Ratio ➝ Less Credit Risk
- Higher Financial Leverage Ratio ➝ Higher Credit Risk
Given a lower financial leverage ratio, the borrower’s operations and past asset purchases are implied to have been financed using predominately equity capital and a relatively smaller portion of debt.
The core objective of a corporation is to maximize shareholder wealth, per financial management theory.
Further, the optimal capital structure – the capital structure at which the weighted average cost of capital (WACC) is minimized while the firm valuation is maximized – usually contains some debt for most companies, barring unusual circumstances.
Why? Interest expense is tax-deductible and creates a “tax shield” that reduces the amount of taxable income (EBT), which is one of the key incentives to use debt.
The management team must raise an appropriate amount of debt that their company can reasonably handle with a sufficient “cushion” to benefit from the tax-deductibility of interest, without placing the company at risk of default.
Therefore, financial leverage creates the potential to earn outsized returns on behalf of shareholders, but also presents the risk of outright bankruptcy if performance falls short of expectations.
How to Analyze Financial Leverage
The following lists contain the most common methods to analyze the leverage risk of a company, aside from the financial leverage ratio.
Leverage Ratio
- Total Leverage Ratio = Total Debt ÷ EBITDA
- Senior Debt Ratio = Senior Debt ÷ EBITDA
- Net Debt Leverage Ratio = Net Debt ÷ EBITDA
Capitalization Ratio
- Debt to Equity Ratio (D/E) = Total Debt ÷ Total Shareholders’ Equity
- Debt to Capital Ratio = Total Debt ÷ Total Capitalization
- Long Debt to Capital Ratio = Long-Term Debt ÷ Total Capitalization
- Interest Coverage Ratio = EBIT ÷ Interest Expense
- Cash Interest Coverage Ratio = EBIT ÷ (Interest Expense – PIK Interest)
- Fixed Charge Coverage Ratio (FCCR) = (EBIT + Fixed Charges Before Taxes) ÷ (Fixed Charges Before Taxes + Interest Expense)
What are the Risks of Financial Leverage?
The use of financial leverage has many drawbacks that borrowers must consider before formally committing to a lending agreement.
- Risk of Default → Perhaps the most significant disadvantage of financial leverage – the risk of default – refers to a borrower being unable to fulfill an interest payment on time or repay the principal.
- Financing Costs → The other drawback is the financing costs, which include interest and principal repayment. The debt burden must therefore be carefully considered to ensure that the risk of default is kept to a manageable level.
- Debt Burden → The greater the proportion of debt in a company’s capital structure, the more credit risk attributable to the borrowing, because the interest owed to the lender is a direct function of the principal amount and interest rate, so more debt coincides with more interest owed.
- Variability of Income (EPS) → Financial leverage presents the risk of incurring disproportionate losses. The borrower must generate sufficient earnings to offset interest expense and debt service payments, even in periods of underperformance, i.e. leverage causes the fluctuations in earnings to rise.
- Industry Risk → The industry in which the company operates is another critical factor to consider. For instance, a cyclical business is not suited to utilize significant debt. There are exceptions, of course, such as telecom companies where the market is an oligopoly.
How Does Financial Leverage Affect Net Income and EPS?
Financial leverage amplifies the variation in both earnings per share (EPS) and return on equity (ROE). Therefore, the decision to use leverage is a “double-edged sword.”
A company that performs well in a given period will have more residual net income, which can either flow into retained earnings or be issued as shareholder dividends.
By generating more net income, the reported earnings per share (EPS) figure will be higher – all else being equal.
Because the funds used for such purposes belong to the lender – i.e. must be repaid in full at maturity – the use of leverage can cause returns to rise.
The return on equity (ROE) is therefore greater, since the borrowed funds are not included in its calculation.
Conversely, a period of poor financial performance will also cause the effect to be greater, just in the negative direction.
Financial Leverage Calculator — Excel Template
We’ll now move to a modeling exercise, which you can access by filling out the form below.
Financial Leverage Calculation Example
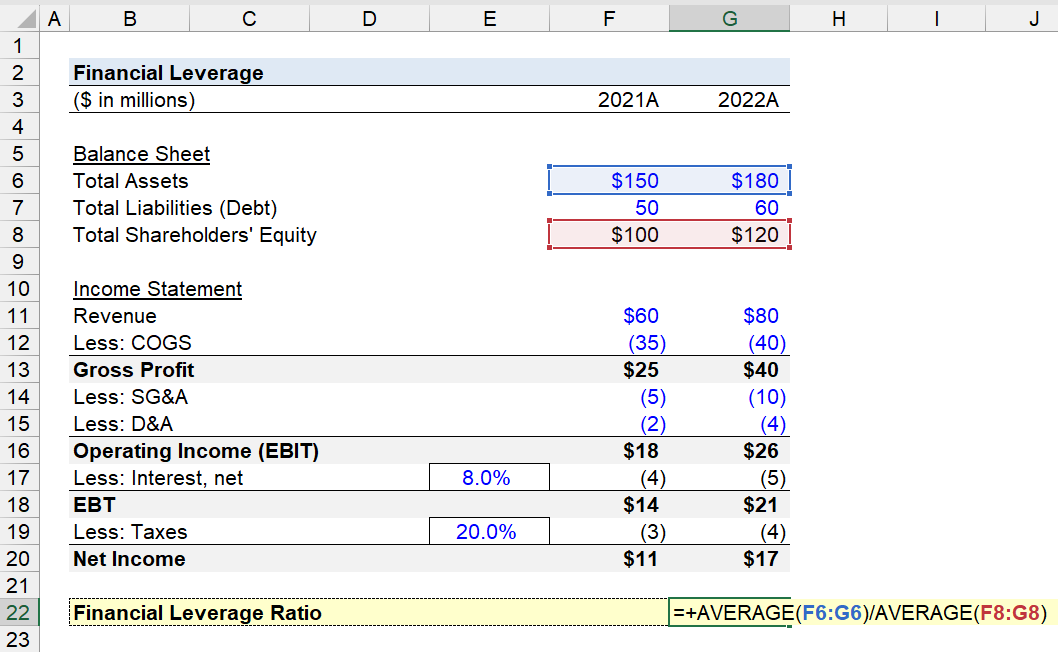
Suppose we’re tasked with calculating the financial leverage ratio of a company as of 2022.
The company’s balance sheet data is as follows.
| Selected Balance Sheet Data | ||
|---|---|---|
| ($ in millions) | 2021A | 2022A |
| Total Assets | $150 | $180 |
| Total Liabilities (Debt) | 50 | 60 |
| Total Shareholders’ Equity | $100 | $120 |
To perform some credit ratio analysis, alongside computing the financial leverage ratio, the following is the income statement data of our company.
| Income Statement | ||
|---|---|---|
| ($ in millions) | 2021A | 2022A |
| Revenue | $60 | $80 |
| Less: COGS | (35) | (40) |
| Gross Profit | $25 | $40 |
| Less: SG&A | (5) | (10) |
| Less: D&A | (2) | (4) |
| Operating Income (EBIT) | $18 | $26 |
| Less: Interest, net @ 8.0% Interest Rate | (4) | (5) |
| Pre-Tax Income (EBT) | $14 | $21 |
| Less: Taxes @ 20.0% Tax Rate | (3) | (4) |
| Net Income | $11 | $17 |
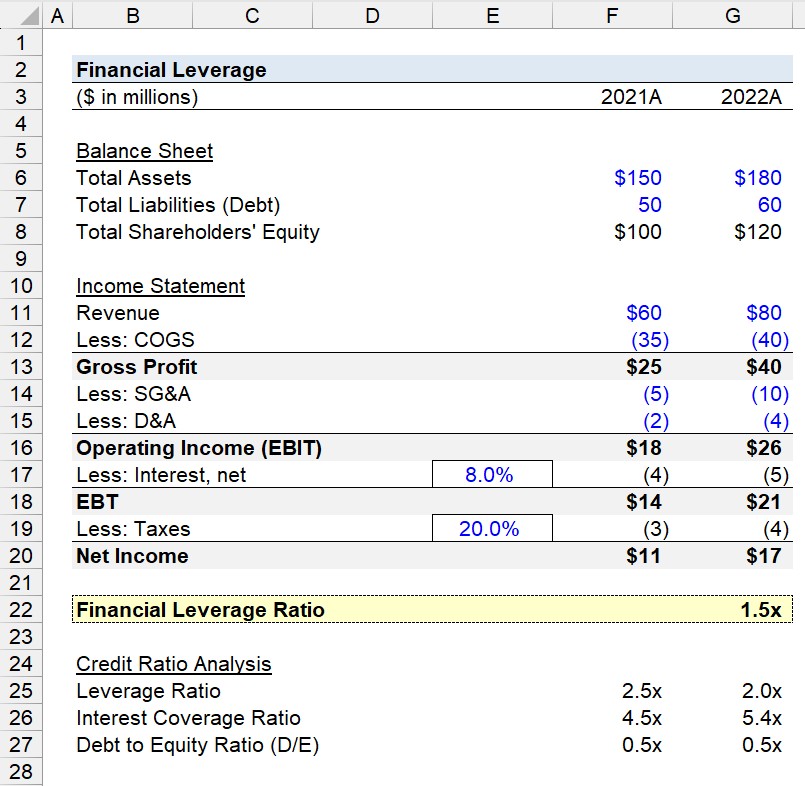
The calculation of the financial leverage ratio is rather straightforward. By calculating the average balance of our company’s total assets and dividing by its total shareholders’ equity, we arrive at a financial leverage ratio of 1.5x.
- Financial Leverage Ratio = [($150 million + $180 million) ÷ 2] ÷ [($100 million + $120 million) ÷ 2] = 1.5x
Based on the historical data from the trailing two periods of our hypothetical company, there is $1.50 of total debt for each $1.00 of total assets on its balance sheet.
From that point onward, we’ll calculate three distinct credit ratios — the leverage ratio, interest coverage ratio, and debt to equity (D/E) ratio – to better grasp the financial health of our company.
After entering each assumption into the applicable formula, we can derive that the company’s credit risk is on the lower end, based on the following metrics for fiscal year ending 2021 and 2022, respectively.
- Leverage Ratio ➝ 2.5x and 2.0x
- Interest Coverage Ratio ➝ 4.5x and 5.4x
- Debt to Equity Ratio (D/E) ➝ 0.5x and 0.5x

Everything You Need To Master Financial Modeling
Enroll in The Premium Package: Learn Financial Statement Modeling, DCF, M&A, LBO and Comps. The same training program used at top investment banks.
Enroll Today


