
What is Net Debt to EBITDA?
The Net Debt to EBITDA Ratio is a measure of leverage risk, where the net debt of a borrower (i.e. total debt minus cash and cash equivalents) is compared to its EBITDA over a specified period.
How to Calculate Net Debt to EBITDA Ratio
The net debt to EBITDA ratio—or “Net Debt/EBITDA”—is a type of leverage ratio used to determine if a borrower generates sufficient operating cash flows to meet its mandatory interest obligations and pay down its outstanding debt balance in full at maturity.
There are two components to the net debt to EBITDA ratio:
- Net Debt → The net debt metric equals the sum of a company’s total debt and any interest-bearing securities minus cash and cash equivalents. The debt component is inclusive of short-term and long-term borrowings, whereas the cash and cash equivalents component consists of cash and any other highly-liquid current assets such as marketable securities, commercial paper and other short-term investments.
- EBITDA → The EBITDA metric is a non-GAAP metric that reflects the normalized operating profitability of a company. EBITDA stands for “Earnings Before Interest, Taxes, Depreciation and Amortization”, so the effects of a company’s capital structure (i.e. the percent mix of debt and equity), taxes and non-cash expenses are neglected.
The rationale for using the net debt metric, rather than gross debt, is to reflect a more accurate picture of a company’s actual debt burden. If deemed necessary, cash on hand and cash-like, liquid assets belonging to a company can be utilized to reduce the outstanding debt balance.
Therefore, the credit profile of a specific borrower – in particular, the risk of default – can be gauged from an arguably more accurate perspective by using the net debt to EBITDA ratio.
The following three-step process can be followed to calculate the net debt to EBITDA ratio.
- Calculate Net Debt → (Gross Debt + Interest Bearing Securities) – Cash and Cash Equivalents
- Calculate EBITDA → EBIT + Depreciation and Amortization (D&A) + Non-Recurring Items
- Divide Net Debt by EBITDA → Net Debt ÷ EBITDA
What is a Good Net Debt to EBITDA Ratio?
Since the net debt to EBITDA ratio measures a company’s net debt relative to its EBITDA, a lower ratio implies less credit risk.
Hence, risk-averse lenders such as banks often place maintenance covenants that restrict the borrower from dipping below a certain threshold ratio, as part of the lending agreement.
In contrast, a higher net debt to EBITDA ratio signifies that the borrower might be at risk of default, e.g. may be unable to meet periodic interest payment or mandatory principal repayments on time (“red flag”).
Based on the perceived risk of the borrowing, the underwriters that structure and offer debt financing rely on the net debt to EBITDA ratio to estimate the appropriate amount of debt to provide, including the terms such as the interest rate.
The debt capacity and financial stability of a borrower is assumed to be greater if the net debt leverage ratio can withstand the downside case assumptions of a lender model, i.e. the liquidity and cash flows of the company can handle a significant debt load even in periods of underperformance.
- Lower Net Debt-to-EBITDA Ratio → Less Default Risk and Greater Debt Capacity
- Higher Net Debt-to-EBITDA Ratio → More Default Risk and Less Debt Capacity
Net Debt to EBITDA Formula
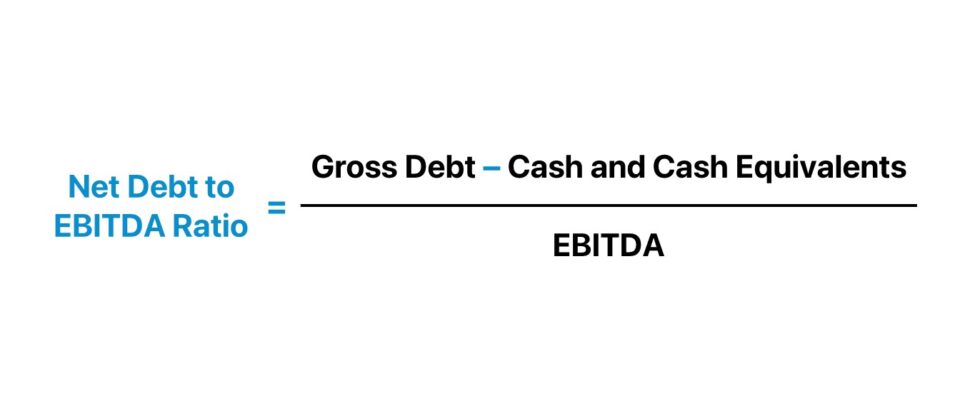
The formula to calculate the net debt to EBITDA ratio is equal to net debt divided by EBITDA in the corresponding period.
Where:
- Net Debt = (Short-Term Debt + Long-Term Debt) – Cash and Cash Equivalents
- EBITDA = EBIT + Depreciation and Amortization (D&A) + Non-Recurring Items
EBITDA is a non-GAAP metric for which there is no standardized method of computation.
The most straightforward method of calculating EBITDA consists of adjusting operating income (EBIT) for non-cash add backs, namely for depreciation and amortization expense.
However, other discretionary adjustments are often applied in practice, i.e. “Adjusted EBITDA”, which should be closely examined to ensure each adjustment is reasonable.
Net Debt to EBITDA Calculator
We’ll now move to a modeling exercise, which you can access by filling out the form below.
Net Debt to EBITDA Ratio Calculation Example
Suppose you’re tasked with calculating the net debt to EBITDA ratio for a potential borrower given the following pro forma financial data.
Year 1: Financial Assumptions
- Short-Term Debt = $40 million
- Long-Term Debt = $180 million
- Cash and Cash Equivalents = $60 million
Year 1: Operating Assumptions
- EBIT = $30 million
- Depreciation and Amortization (D&A) = $10 million
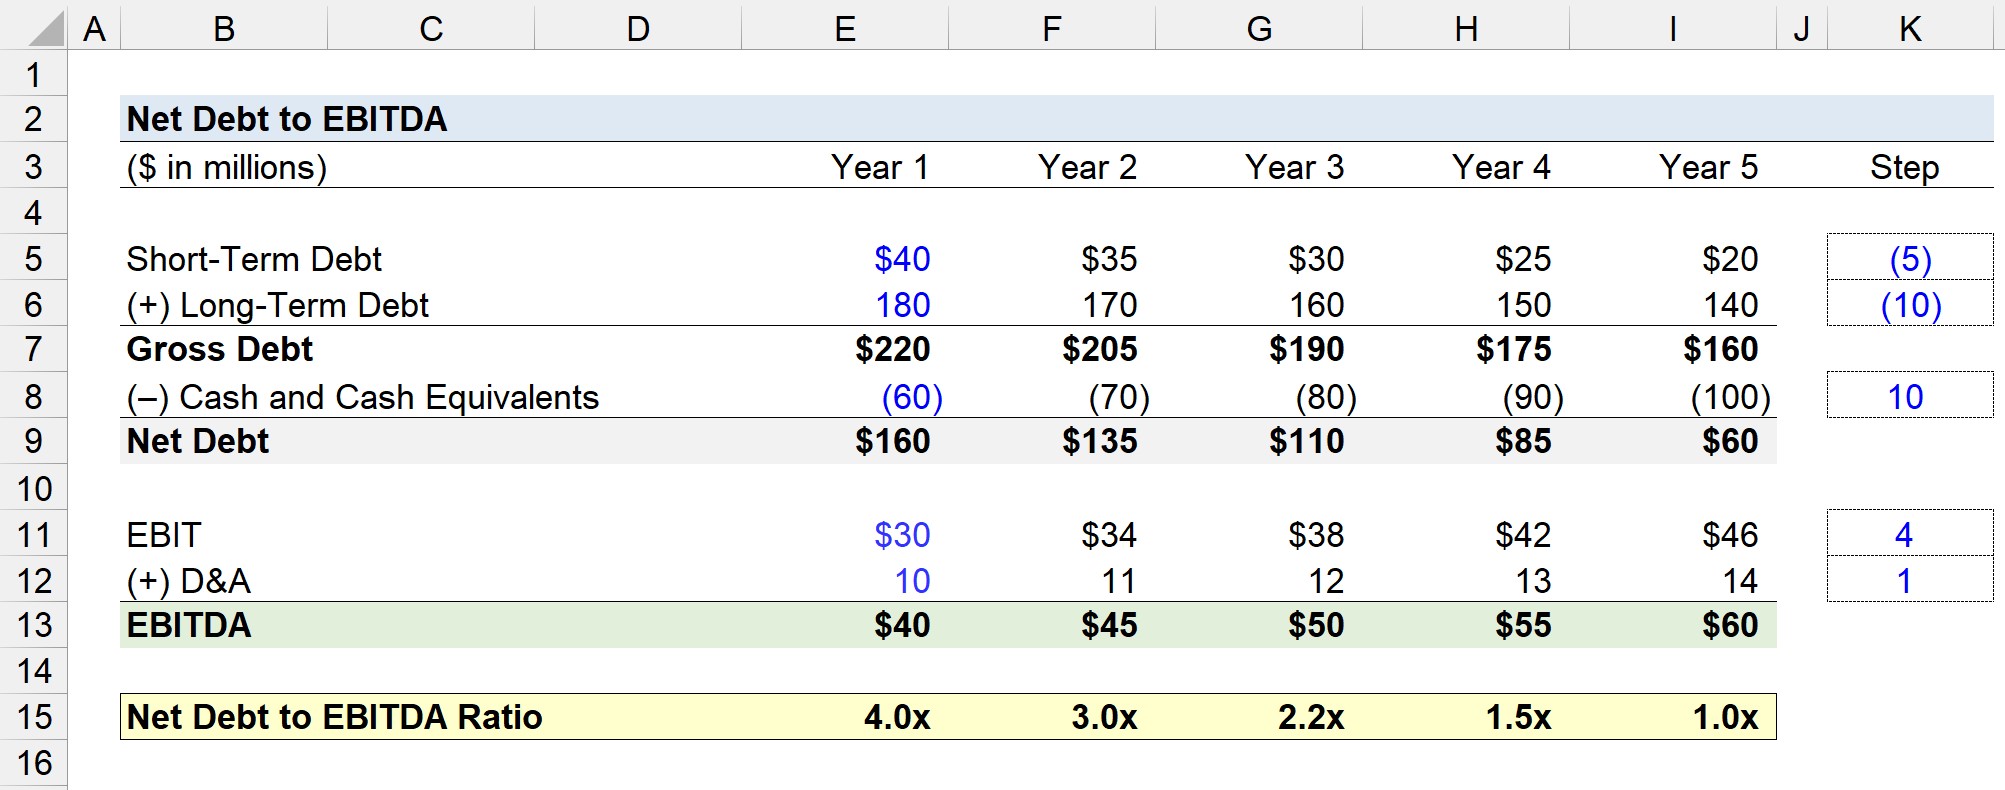
Given those assumptions, we can determine the net debt in Year 1 is $160 million, while EBITDA is $40 million.
- Net Debt, Year 1 = ($40 million + $180 million) – $60 million = $160 million
- EBITDA, Year 1 = $30 million + $10 million = $40 million
By dividing the net debt balance by EBITDA, the net debt leverage ratio is 4.0x in Year 1.
- Net Debt to EBITDA Ratio = $160 million ÷ $40 million = 4.0x
For each period in the rest of the forecast, Year 2 to Year 5, we’ll assume a $5 million and $10 million paydown of the short-term debt and long-term debt, respectively.
- Short-Term Debt Paydown, Step Function = ($5 million)
- Long-Term Debt Paydown, Step Function = ($10 million)
In addition, the cash and cash equivalents balance will increase by $10 million per year across the same projection period.
- Cash and Cash Equivalents, Step Function = $10 million
From Year 1 to Year 5, the net debt balance declined from $160 million to $60 million.
On the other hand, EBIT will increase by $4 million per year, while the D&A expense (i.e. non-cash add-back) will increase by $1 million.
- EBIT, Step Function = $4 million
- D&A, Step Function = $1 million
From Year 1 to Year 5, our company’s EBITDA expands from $40 million to $60 million.
Like earlier, we’ll determine the net debt to EBITDA ratio for each period, which reflects a reduction from 4.0x to 1.0x, i.e. the final year net debt balance is equal to the EBITDA generated.

Everything You Need To Master Financial Modeling
Enroll in The Premium Package: Learn Financial Statement Modeling, DCF, M&A, LBO and Comps. The same training program used at top investment banks.
Enroll Today


