 Skip to main content
What is Quick Ratio?
The Quick Ratio is a short-term liquidity ratio that compares the value of a company’s cash balance and highly liquid current assets to its near-term obligations.
Otherwise referred to as the “acid test” ratio, the quick ratio’s distinction from the current ratio is that a more stringent criterion is applied for the current assets included in the calculation.

How to Calculate Quick Ratio
The quick ratio compares the short-term assets of a company to its short-term liabilities to determine if the company would have adequate cash to pay off its short-term liabilities.
Calculating the quick ratio involves dividing a company’s current cash & equivalents (e.g. marketable securities) and accounts receivable by its current liabilities.
Conceptually, the quick ratio answers the question, “Does the company have enough cash to pay off its short-term liabilities, such as debt obligations soon coming due?”
The core components of the metric include the following line items:
- Current Assets ➝ Cash and Cash Equivalents, Marketable Securities, Accounts Receivable (A/R)
- Current Liabilities ➝ Accounts Payable (A/P), Accrued Expense, Short-Term Debt
In the calculation of the quick ratio, the items considered part of current assets are under more stringent rules — which is based on the notion that certain assets are more difficult to liquidate quickly, such as inventory, or may be difficult to sell at the same or relatively similar value (i.e. in a scenario where no substantial discount is required to sell the asset).
The inclusion of illiquid current assets in the calculation can potentially cause a misleading portrayal of the company’s financial condition, as it may misleadingly portray a company as better able to meet its short-term obligations than in reality.
Quick Ratio Formula
The formula for calculating the quick ratio is equal to cash plus accounts receivable, divided by current liabilities.
For example, suppose a company has the following balance sheet data:
Current Assets:
- Cash = $20 million
- Marketable Securities = $10 million
- Accounts Receivable (A/R) = $20 million
- Inventory = $40 million
Current Liabilities:
- Accounts Payables = $30 million
- Short-Term Debt = $10 million
Next, the required inputs can be calculated using the following formulas.
- Current Assets = $20 million + $10 million + $20 million = $50 million
- Current Liabilities = $30 million + $10 million = $40 million
Illiquid assets are excluded from the calculation of the quick ratio, as mentioned earlier. Hence, inventory is not included in the calculation.
In the final step, we’ll divide the liquid current assets by the current liabilities to arrive at the quick ratio:
- Quick Ratio = $50 million ÷ $40 million = 1.25x
Quick Ratio vs. Current Ratio: What is the Difference?
Similar to the current ratio, which compares current assets to current liabilities, the quick ratio is also categorized as a liquidity ratio.
Both types of liquidity ratios are calculated under a hypothetical scenario in which a company must pay off all existing current liabilities that have come due using its current assets.
However, the difference between the two is that the quick ratio includes only the current assets that can be converted into cash within 90 days or less, while the current ratio includes all current assets that can be converted into cash within one year.
The quick ratio is therefore considered more conservative than the current ratio, since its calculation intentionally ignores more illiquid items like inventory.
What is a Good Quick Ratio?
While dependent on the specific industry, the quick ratio should exceed >1.0x for the vast majority of industries.
The two general rules of thumb for interpreting the quick ratio are as follows.
- Higher Quick Ratio → Sufficient Coverage of Current Liabilities
- Lower Quick Ratio → Insufficient Coverage of Current Liabilities
The quick ratio measures if a company, post-liquidation of its liquid current assets, would have enough cash to pay off its immediate liabilities — so, the higher the ratio, the better off the company is from a liquidity standpoint.
If the ratio is low, the company should likely proceed with some degree of caution, and the next step would be to determine how and how quickly more capital could be obtained.
For example, a company with a low ratio might not be at too much of a risk if it has non-core fixed assets on standby that could be sold relatively quickly.
In fact, such a company may be viewed favorably by the equity or debt capital markets and be able to raise capital easily.
But a higher ratio should NOT automatically be interpreted as a positive sign without further research into the company’s drivers – e.g. a company can have a healthy quick ratio of 2.0x, yet the majority of its current assets are A/R where the collection of payment from customers is not always guaranteed.
While a higher amount of asset collateral is perceived positively under a liquidation scenario, most companies focus more on forward-looking performance like free cash flow (FCF) generation and profit margins, although all of these aspects are ultimately interconnected.
Quick Ratio Calculator
We’ll now move to a modeling exercise, which you can access by filling out the form below.
1. Quick Ratio Calculation Example
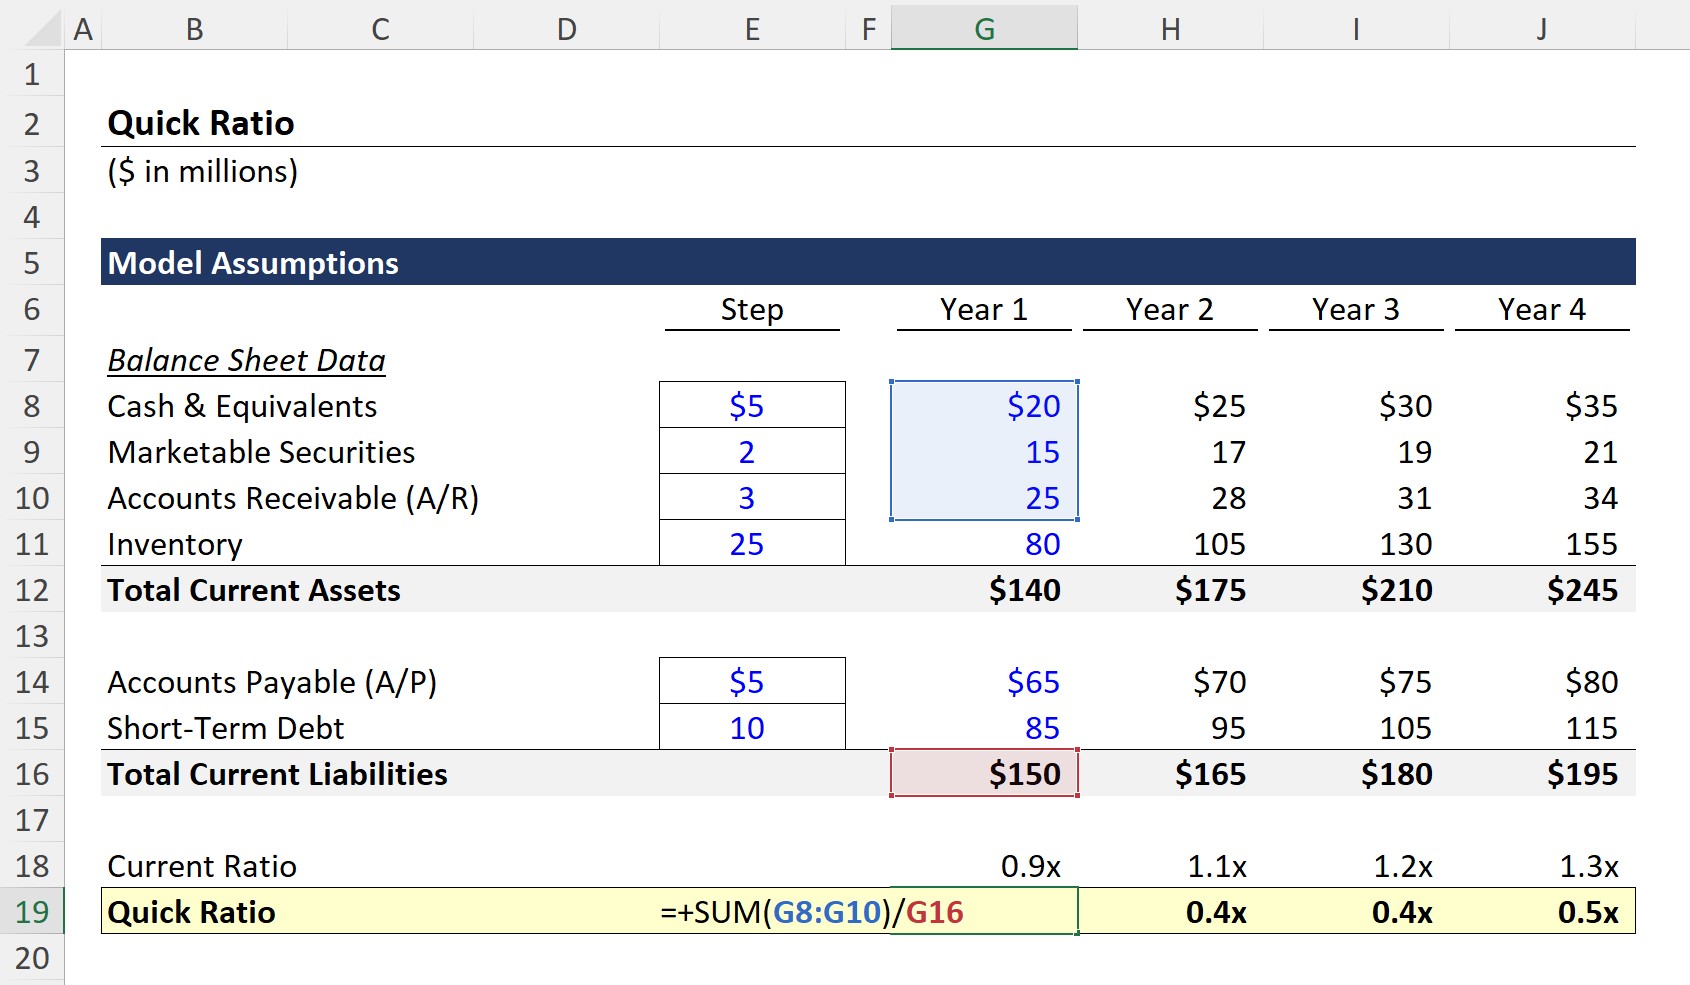
Suppose a company has the following balance sheet financial data in Year 1, which we’ll use as our assumptions for our model.
Current Assets:
- Cash & Equivalents = $20m
- Marketable Securities = $15m
- Accounts Receivable (A/R) = $25m
- Inventory = $80m
Current Liabilities:
- Accounts Payable = $65m
- Short-Term Debt = $85m
In Year 1, the quick ratio can be calculated by dividing the sum of the liquid assets ($20m Cash + $15m Marketable Securities + $25m A/R) by the current liabilities ($150m Total Current Liabilities).
- Quick Ratio, Year 1 = $60m ÷ $150m = 0.4x
The company appears not to have enough liquid current assets to pay its upcoming liabilities.
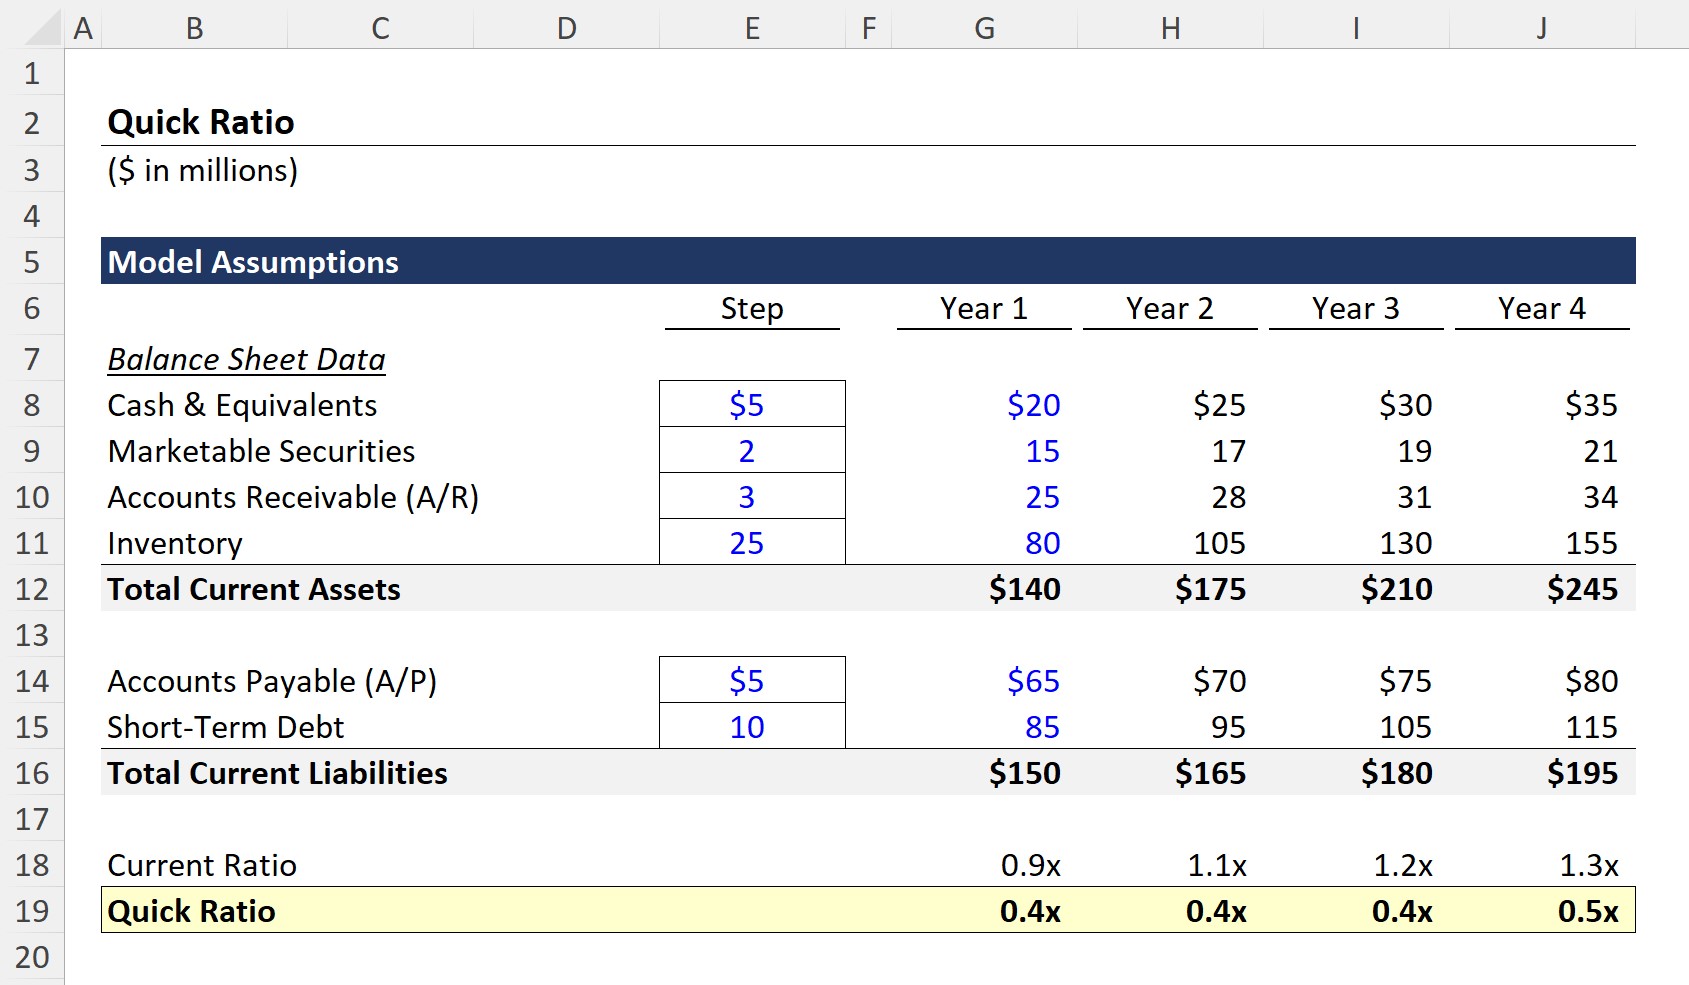
From Year 2 to Year 4, we’ll use a step function for each B/S line item with the following assumptions.
Current Assets:
- Cash and Cash Equivalents → +$5m
- Marketable Securities → +$2m
- Accounts Receivable (A/R) → +$3m
- Inventory → +$25m
Current Liabilities:
- Accounts Payable → +$5m
- Short-Term Debt → +$10m
Upon dividing the sum of the cash and cash equivalents, marketable securities, and accounts receivable balance by the total current liabilities balance, we arrive at the quick ratio for each period.
At the end of the forecast period, Year 4, our company’s ratio remains relatively unchanged at 0.5x, which is problematic, as concerns regarding short-term liquidity remain.
2. Quick Ratio Analysis Example
The current ratio in Year 4 is 1.3x, a substantial improvement from the 0.9x ratio in Year 1.
While the high inventory balance and growth benefit the current ratio, the quick ratio excludes illiquid current assets such as inventory. The gap between the current ratio and quick ratio stems from the inventory line item, which comprises a significant portion of the total current assets balance.
The inventory balance of our company expanded from $80m in Year 1 to $155m in Year 4, reflecting an increase of $75m.
Our company’s current ratio of 1.3x is not necessarily positive, since a range of 1.5x to 3.0x is usually ideal, but it is certainly less alarming than a quick ratio of 0.5x.
On one note, the inventory balance can be helpful when raising debt capital (i.e. collateral), as long as there are no existing liens placed on the inventory or any other contractual restrictions.
Yet, the broader concern here is that the cause of the accumulating inventory balance is declining sales or lackluster customer demand for the company’s products/services.

Everything You Need To Master Financial Modeling
Enroll in The Premium Package: Learn Financial Statement Modeling, DCF, M&A, LBO and Comps. The same training program used at top investment banks.
Enroll Today


