
- What is Current Ratio?
- How to Calculate Current Ratio
- Current Ratio Formula
- Current Ratio Calculation Example
- What is a Good Current Ratio?
- What are the Limitations of Current Ratio?
- Current Ratio vs. Quick Ratio: What is the Difference?
- Current Ratio Calculator
- 1. Balance Sheet Assumptions
- 2. Working Capital Calculation Example
- 3. Current Ratio Calculation Example
What is Current Ratio?
The Current Ratio is a measure of a company’s near-term liquidity position, or more specifically, the short-term obligations coming due within one year.
Often used alongside the quick ratio, the current ratio measures if a company can meet its short-term obligations using its short-term assets on the present date.

- The current ratio is a financial metric that measures the liquidity of a company by comparing the current assets belonging to a company to its current liabilities to determine if the liquid assets are sufficient to meet its short-term obligations coming due within twelve months (or one-year).
- The current ratio formula is the current assets of a company divided by its current liabilities.
- A current ratio of around 1.5x to 3.0x is considered to be healthy, whereas a current ratio below 1.0x is deemed a red flag that implies the near-term liquidity of the company presents risks.
- The current ratio is different from the quick ratio because the metric is less conservative because the formula includes all current assets, rather than only those confirmed to be truly liquid.
How to Calculate Current Ratio
The current ratio is categorized as a liquidity ratio, since the financial metric assesses how financially sound the company is in relation to its near-term liabilities.
Liquidity ratios generally have a near-term focus, hence the two main inputs are current assets and current liabilities.
- Current Assets → Cash and Cash Equivalents, Marketable Securities, Accounts Receivable (A/R), Inventory
- Current Liabilities → Accounts Payable (A/P), Accrued Expense, Deferred Revenue (D/R), Short-Term Debt (<12 Month)
The current ratio reflects a company’s capacity to pay off all its short-term obligations, under the hypothetical scenario that short-term obligations are due right now.
Current Ratio Formula
The formula to calculate the current ratio divides a company’s current assets by its current liabilities.
Since the current ratio compares a company’s current assets to its current liabilities, the required inputs can be found on the balance sheet.
Often, the current ratio tends to also be a useful proxy for how efficient the company is at working capital management.
Current Ratio Calculation Example
Suppose a company has the following balance sheet data:
Current Assets:
- Cash = $25 million
- Marketable Securities = $20 million
- Accounts Receivable (A/R) = $10 million
- Inventory = $60 million
Current Liabilities:
- Accounts Payable (A/P) = $55 million
- Short-Term Debt = $60 million
With that said, the required inputs can be calculated using the following formulas.
- Current Assets = $25 million + $20 million + $10 million + $60 million = $115 million
- Current Liabilities = $55 million + $60 million = $115 million
For the last step, we’ll divide the current assets by the current liabilities.
- Current Ratio = $115 million ÷ $115 million = 1.0x
The current ratio of 1.0x is right on the cusp of an acceptable value, since if the ratio dips below 1.0x, that means the company’s current assets cannot cover its current liabilities.
If the ratio were to drop below the 1.0x “floor”, raising external financing would become urgent.
What is a Good Current Ratio?
The range used to gauge the financial health of a company using the current ratio metric varies on the specific industry.
For instance, supermarket retailers typically have low current ratios considering their business model (and free cash flows) are essentially a function of their ability to raise more debt to fund asset purchases (i.e. increases debt on B/S), as well as pushing back supplier/vendor payments (i.e. increasing accounts payable)
As a general rule of thumb, a current ratio in the range of 1.5 to 3.0 is considered healthy.
- Current Ratio >1.5x → The company has sufficient current assets to pay off its current liabilities
- Current Ratio = 1.0x → The company has sufficient current assets to meet its current liabilities, however, there is no margin for error (i.e. no “cushion”)
- Current Ratio <1.0x → The company has insufficient current assets to pay off its current liabilities
However, a current ratio <1.0 could be a sign of underlying liquidity problems, which increases the risk to the company (and lenders if applicable).
Tracking the current ratio can be viewed as “worst-case” scenario planning (i.e. liquidation scenario) — albeit, the company’s business model may just require fewer current assets and comparatively more current liabilities.
Here, the company could withstand a liquidity shortfall if providers of debt financing see the core operations are intact and still capable of generating consistent cash flows at high margins.
But a higher current ratio is NOT necessarily always a positive sign — instead, a ratio in excess of 3.0x can result from a company accumulating current assets on its balance sheet (e.g. cannot sell inventory to customers).
While under a liquidation scenario, a higher amount of asset collateral is perceived positively, most companies focus on forward-looking performance like free cash flow (FCF) generation and profit margins, although everything is linked to one another in some ways.
What are the Limitations of Current Ratio?
The limitations of the current ratio – which must be understood to properly use the financial metric – are as follows.
- Minimum Cash Balance → One shortcoming of the metric is that the cash balance includes the minimum cash amount required for working capital needs. Without the minimum cash on hand for operations to continue, as usual, the business cannot continue to run if its cash were to dip below this level — e.g. the company is struggling to collect owed cash payments from customers that paid on credit.
- Restricted Cash → Likewise, the cash balance could contain restricted cash, which is not freely available for use by the business and is instead held for a specific purpose.
- Illiquid Short-Term Investments → Next, the inclusion of short-term investments that cannot be liquidated in the markets easily could also have been included — i.e. low liquidity and cannot sell without selling at a loss at a substantial discount.
- Bad A/R (Uncollectible) → The last drawback to the current ratio that we’ll discuss is the accounts receivable amount can include “Bad A/R”, which is uncollectible customer payments, but management refuses to recognize it as such.
Current Ratio vs. Quick Ratio: What is the Difference?
Another practical measure of a company’s liquidity is the quick ratio, otherwise known as the “acid-test” ratio.
The formula to compute the quick ratio is as follows.
In comparison to the current ratio, the quick ratio is considered a more strict variation due to filtering out current assets that are not actually liquid — i.e. cannot be sold for cash immediately.
By adjusting the numerator to include solely highly liquid assets that can truly be converted into cash in <90 days with a high degree of certainty, the quick ratio is a more conservative measure of liquidity.
Current Ratio Calculator
We’ll now move to a modeling exercise, which you can access by filling out the form below.
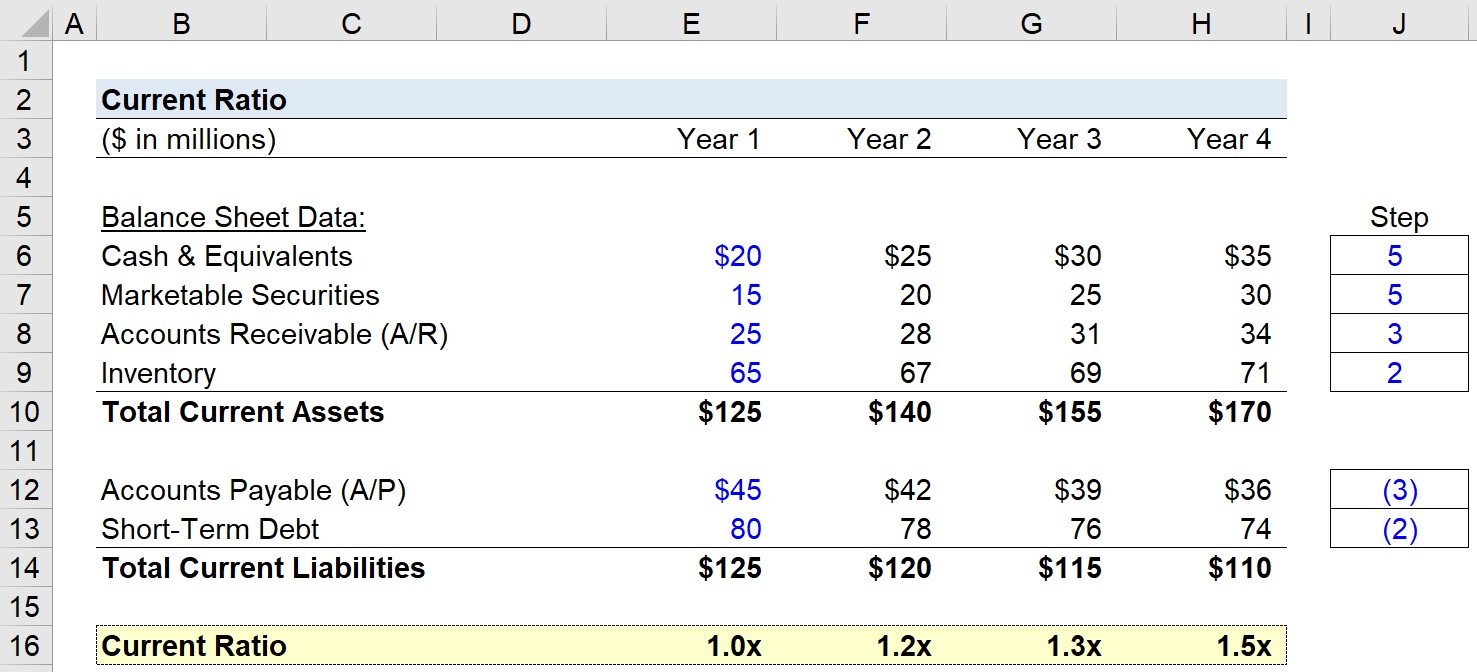
1. Balance Sheet Assumptions
Suppose we’re tasked with analyzing the liquidity of a company with the following balance sheet data in Year 1.
Current Assets:
- Cash and Cash Equivalents = $20 million
- Marketable Securities = $15 million
- Accounts Receivable (A/R) = $25 million
- Inventory = $65 million
Current Liabilities:
- Accounts Payable: $45 million
- Short-Term Debt: $80 million
Putting the above together, the total current assets and total current liabilities each add up to $125m, so the current ratio is 1.0x as expected.
The company has just enough current assets to pay off its liabilities on its balance sheet.
2. Working Capital Calculation Example
As for the projection period – from Year 2 to Year 4 – we’ll use a step function for each B/S line item, with the Year 1 figures serving as the starting point.
Our assumptions for the changes in working capital line items are as follows.
Current Assets:
- Cash and Cash Equivalents = +$5 million/Year
- Marketable Securities = +$5 million/Year
- Accounts Receivable (A/R) = +$3 million/Year
- Inventory = +$2 million/Year
Current Liabilities:
- Accounts Payable (A/P) = –$3 million/Year
- Short-Term Debt = –$2 million/Year
3. Current Ratio Calculation Example
Clearly, the company’s operations are becoming more efficient, as implied by the increasing cash balance and marketable securities (i.e. highly liquid, short-term investments), accounts receivable, and inventory.
By dividing the current assets balance of the company by the current liabilities balance in the coinciding period, we can determine the current ratio for each year.
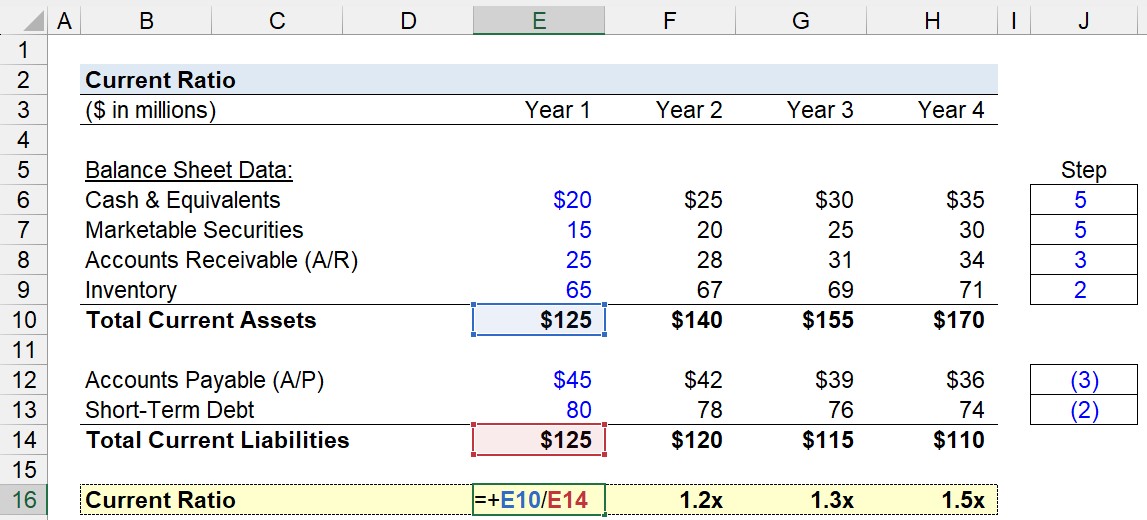
From Year 1 to Year 4, the current ratio increases from 1.0x to 1.5x.
- Current Ratio – Year 1 = $125 million ÷ $125 million = 1.0x
- Current Ratio – Year 2 = $140 million ÷ $120 million = 1.2x
- Current Ratio – Year 3 = $155 million ÷ $115 million = 1.3x
- Current Ratio – Year 4 = $170 million ÷ $110 million = 1.5x
Note the growing A/R balance and inventory balance require further diligence, as the A/R growth could be from the inability to collect cash payments from credit sales.
The increase in inventory could stem from reduced customer demand, which directly causes the inventory on hand to increase — which can be good for raising debt financing (i.e. more collateral), but a potential red flag.
Therefore, applicable to all measures of liquidity, solvency, and default risk, further financial due diligence is necessary to understand the real financial health of our hypothetical company.

Everything You Need To Master Financial Modeling
Enroll in The Premium Package: Learn Financial Statement Modeling, DCF, M&A, LBO and Comps. The same training program used at top investment banks.
Enroll Today


