
- What is Interest Coverage Ratio?
- How to Calculate Interest Coverage Ratio (ICR)
- Interest Coverage Ratio Formula
- Interest Coverage Ratio Calculation Example
- What is a Good Interest Coverage Ratio?
- What are the Different Types of Interest Coverage Ratios?
- Coverage Ratio vs. Leverage Ratio: What is the Difference?
- Interest Coverage Ratio Calculator
- 1. Operating Assumptions
- 2. Income Statement Financial Forecast
- 3. Interest Coverage Ratio Calculation Example
What is Interest Coverage Ratio?
The Interest Coverage Ratio measures a company’s ability to meet required interest expense payments related to its outstanding debt obligations on time.
There are several variations of interest coverage ratios, but generally speaking, most credit analysts and lenders will perceive higher ratios as positive signs of reduced default risk.

How to Calculate Interest Coverage Ratio (ICR)
The interest coverage ratio (ICR) measures the ability of a company to meet scheduled interest obligations coming due on time.
Besides the mandatory repayment of the original debt principal by the date of maturity, the borrower must also service its interest expense payments on schedule to avoid defaulting.
The more debt principal that a company has on its balance sheet, the more interest expense the company will owe to its lenders — all else being equal.
In contrast to leverage ratios, coverage ratios compare a cash flow metric that captures the company’s operating cash flow in the numerator to the amount of interest expense on the denominator.
Operating Cash Flow Metrics:
Of the four metrics, EBITDA tends to output the highest value for an interest coverage ratio since D&A is added back, while “EBITDA – Capex” is the most conservative.
Interest Coverage Ratio Formula
The formula to calculate the interest coverage ratio involves dividing a company’s operating cash flow metric – as mentioned earlier – by the interest expense burden.
Where:
- EBIT = Gross Profit – Operating Expenses (SG&A)
- Interest Expense, net = Interest Expense – Interest Income
The EBIT interest coverage ratio tends to be the most commonly used because it represents the conservative, “middle ground.”
Usually, when practitioners mention the “interest coverage ratio”, it is reasonable to assume they are referring to EBIT.
Interest Coverage Ratio Calculation Example
For instance, if the EBIT of a company is $100 million while the amount of annual interest expense due is $20 million, the interest coverage ratio is 5.0x.
- Interest Coverage Ratio = $100m ÷ $20m = 5.0x
The EBIT of the company can service the $20m in interest expense five times, which means the company’s operating earnings can pay its current interest payment for five “turns.”
But hypothetically, if the EBIT coverage ratio were much lower—let’s say only 1.0x, for example—even a minor drop-off in operating performance could cause a default due to a missed interest expense payment.
What is a Good Interest Coverage Ratio?
For purposes related to lending to a potential borrower and/or providing other forms of capital, interest coverage ratios can be helpful in understanding whether the company’s cash flows are sufficient to pay off the required interest payments on its debt.
- Higher Leverage Ratio→ Higher leverage ratios equate to more financial risk, meaning the borrower’s probability of defaulting on its required debt payments becomes more of a concern.
- Higher Interest Coverage Ratio → For interest coverage ratios, however, the lower the figure, the riskier the credit health of the borrower – which is the opposite of leverage ratios.
Therefore, the higher the number of “turns” for an interest coverage ratio, the more coverage (and reduced risk), because there is more “cushion” in case the company underperforms.
What are the Different Types of Interest Coverage Ratios?
| Coverage Ratio | Formula | Purpose |
| EBITDA Interest Coverage Ratio |
|
|
| EBIT Interest Coverage Ratio |
|
|
| EBITDA Less Capex Interest Coverage Ratio |
|
|
| Fixed Charge Coverage Ratio (FCCR) |
|
|
Coverage Ratio vs. Leverage Ratio: What is the Difference?
Another method to measure risk is leverage ratios, which determine how much debt comprises the entire capital structure. Here, the amount of debt carried by a company is compared to either:
- Capital Sources → e.g. Debt-to-Equity Ratio (D/E), Debt-to-Total Capitalization
- Cash Flow Metrics → e.g. Debt-to-EBITDA, Debt-to-EBIT, Debt-to-EBITDA Less Capex
Interest Coverage Ratio Calculator
We’ll now move to a modeling exercise, which you can access by filling out the form below.
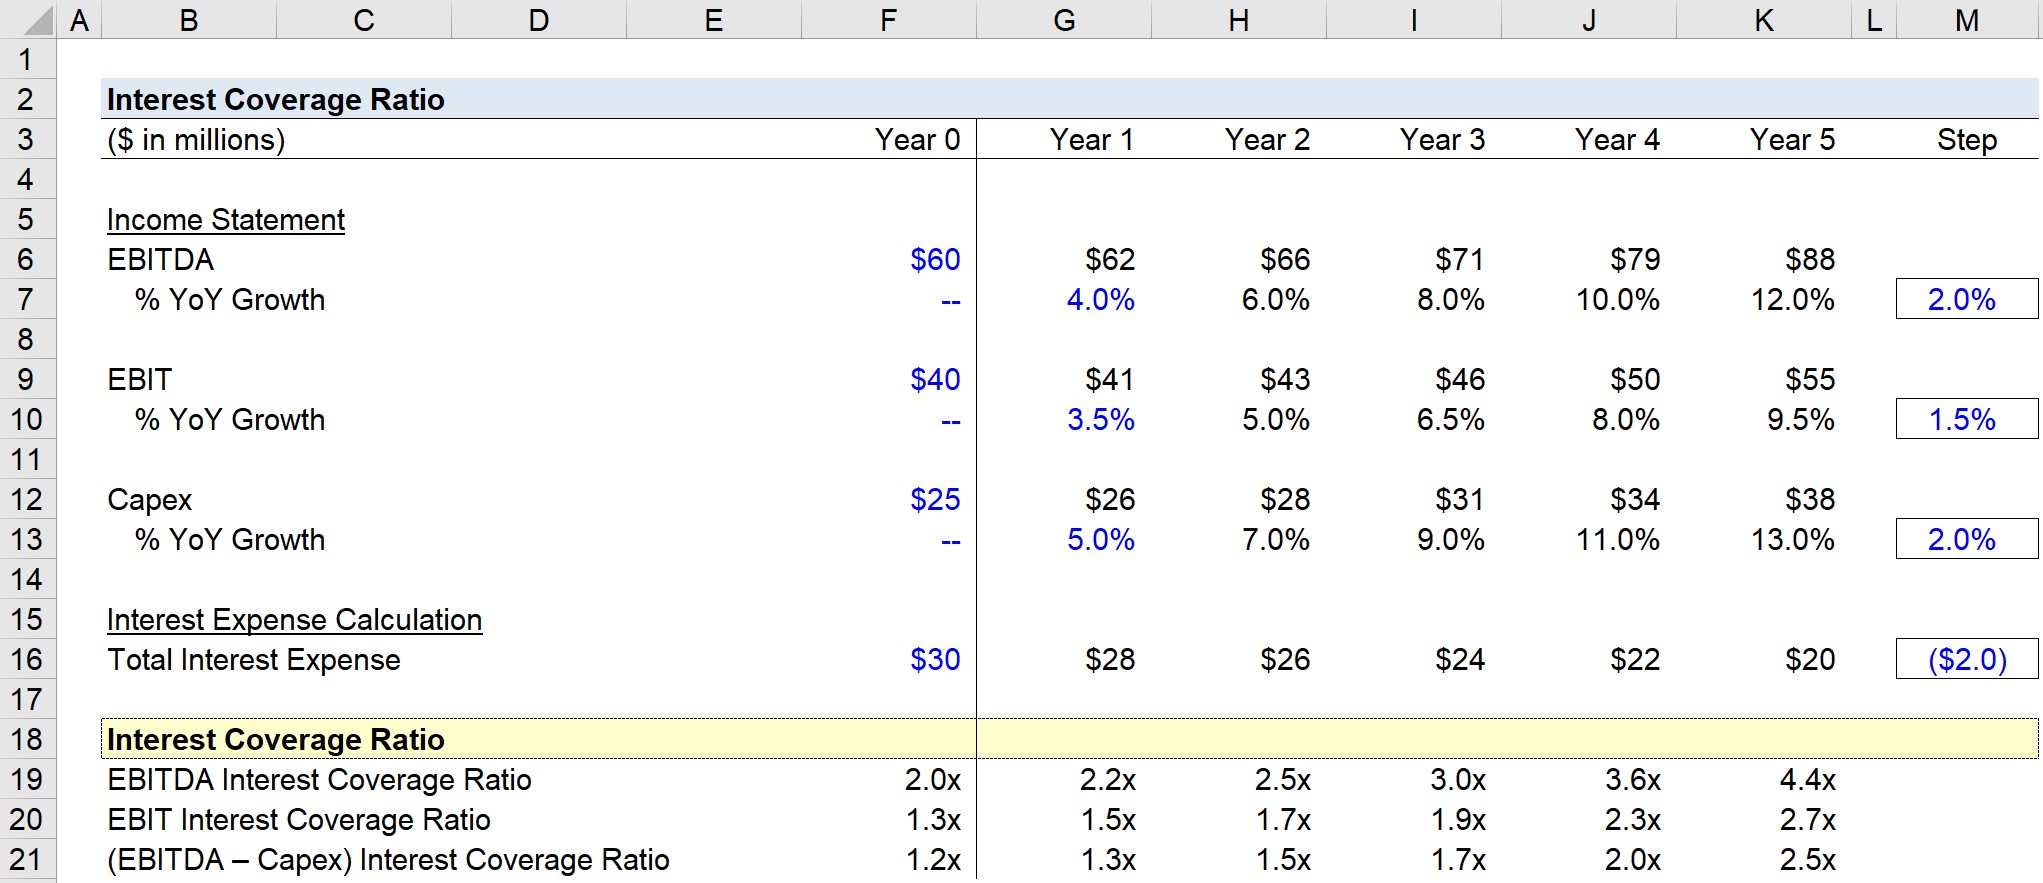
1. Operating Assumptions
Suppose a company had the following select income statement financial data in Year 0.
- EBITDA = $60 million
- EBIT = $40 million
- Capex = $25 million
- Total Interest Expense = $30 million
From Year 1 onward, we’ll use a step function that assumes each line item will grow by the following:
- EBITDA → 4.0% Growth Rate in Year 1 and Increase of +2.0% per Year
- EBIT → 3.5% Growth Rate in Year 1 and Increase of +1.5% per Year
- Capex → 5.0% Growth Rate in Year 1 and Increase of +2.0% per Year
- Total Interest Expense → Decline by –$2m per Year
2. Income Statement Financial Forecast
By the end of Year 5, EBITDA is growing at 12.0% year-over-year (YoY), EBIT is growing by 9.5%, and Capex is growing at 13.0%, which shows how the company’s operations are growing.
However, the pace of the required reinvestments—i.e. capital expenditure (Capex)—to fund the growth is also rapidly increasing in line with the EBITDA growth.
In contrast, the company’s total interest expense is declining from $30m in Year 0 to $20m by the end of Year 5, suggesting the company’s debt principal is declining, which directly leads to lower interest expense since interest is a function of the amount of the outstanding debt principal.
3. Interest Coverage Ratio Calculation Example
Once all the forecasted years have been filled out, we can now calculate the three key variations of the interest coverage ratio.
For each variation, we’ll divide the appropriate cash flow metric by the total interest expense amount due in that particular year.
From Year 0 to Year 5, the interest coverage ratio in each period undergoes the following shifts:
- EBITDA Coverage Ratio: 2.0x → 4.4x
- EBIT Coverage Ratio: 1.3x → 2.7x
- (EBITDA – Capex) Coverage Ratio: 1.2x → 2.5x
Given the outpacing of EBITDA vs. EBIT and the growth of Capex being on par with the growth of EBITDA, the EBITDA variation of the calculated interest coverage ratio is the highest, whereas the (EBITDA – Capex) variation is the lowest of the three types, with the EBIT variation coming in the middle.

Everything You Need To Master Financial Modeling
Enroll in The Premium Package: Learn Financial Statement Modeling, DCF, M&A, LBO and Comps. The same training program used at top investment banks.
Enroll Today

")
")

